

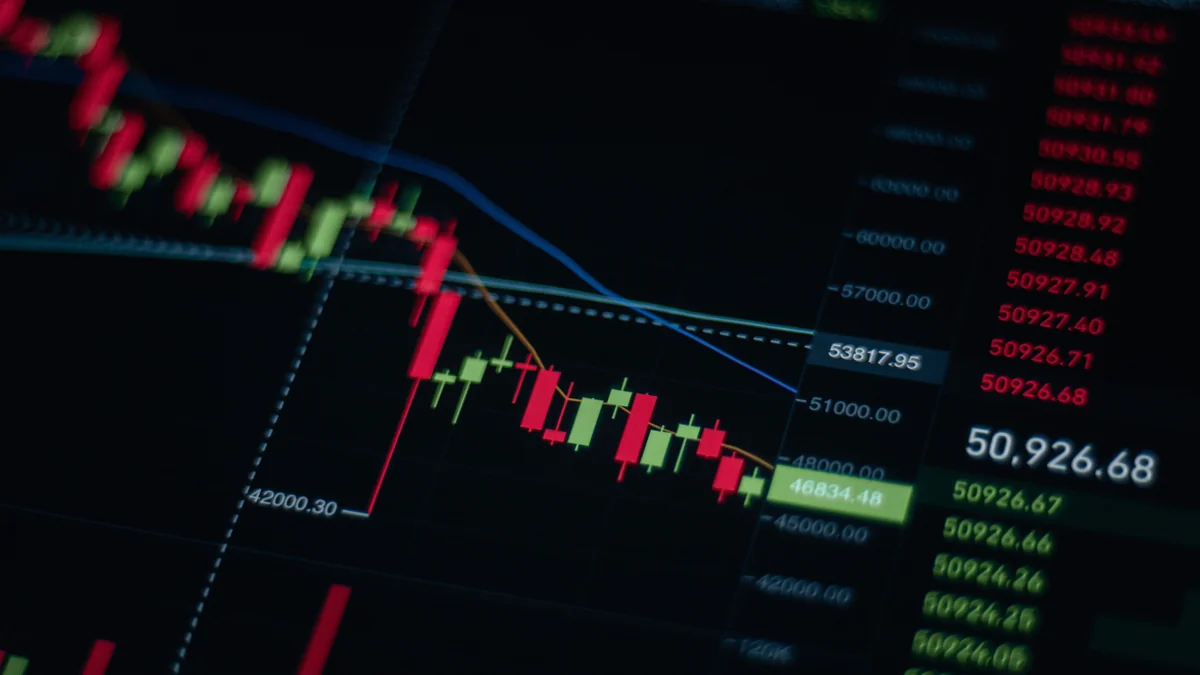
Market prices rarely move in a straight line, yet they often develop a recognizable direction over a period of time. That direction can be useful information for an investor, provided it is treated as evidence about what the market is doing rather than as proof of what it must do next.
The distinction matters because the old debate over market trends is often framed too simply. One side treats price movement as noise that long-term investors should ignore, while the other treats an established trend almost as a forecast. A more useful approach is to recognize that trends and momentum are real features of markets, but their persistence is probabilistic, their strength changes, and the same asset can be in different trends depending on the period being measured.
For investors, the practical question is not whether trends exist. It is what information a trend adds to an investment decision, how much weight that information deserves, and whether acting on it improves the portfolio after trading costs, taxes, false signals and the investor’s own behavioral mistakes are taken into account.
What a market trend actually tells you
A market trend is a sustained tendency for prices to move in a particular direction over the period being observed. An uptrend is characterized by prices making progress higher over time, a downtrend by prices making progress lower, and a sideways or range-bound market by repeated movement without a durable directional advance. These descriptions are simple, but they already contain the most important qualification: a trend exists only in relation to a timeframe.
A stock can be in a long-term uptrend even while falling for several weeks, and it can stage a strong short-term rally inside a much longer decline. A broad stock index can be rising while a particular sector is falling, just as a company can be in a strong individual trend that has little to do with the market as a whole. Calling something “the trend” without identifying the asset and period therefore leaves out information that can change the interpretation completely.
Price direction also tells you what has happened, not why it happened. A sustained advance might reflect improving earnings expectations, falling interest-rate expectations, changes in liquidity, positioning by institutional investors, enthusiasm among individual investors, or several forces acting together. The chart records the net result of those forces in the price, but it does not identify the cause by itself.
This is one reason trend information can be valuable even to an investor who spends most of the time thinking about businesses, valuation and economics. Price is the point at which all buyers and sellers actually meet. A good investment thesis can still be early, a weak thesis can be temporarily rewarded by a strong market, and a change in price behavior can reveal that the market is reassessing an asset before the reason is obvious.
Trend, momentum and technical analysis are related but not identical
Trend and momentum are often used as if they mean the same thing, but they describe different aspects of price behavior. A trend describes direction over a period, while momentum refers to the strength or persistence of movement. A market can still be rising while its momentum is weakening, which is one reason an uptrend sometimes becomes more vulnerable before prices actually turn down.
Market momentum describes the tendency for recent performance to carry forward for a time. Academic research has documented medium-term momentum effects in stock returns, including the body of work associated with Narasimhan Jegadeesh and Sheridan Titman, although the existence of an historical return pattern is not the same as a guarantee that a particular signal will work in the future.[1] The investable question is whether a defined rule captures enough of that persistence to compensate for reversals, trading friction and periods in which the pattern stops working.
Technical analysis is broader than either trend or momentum. It can include price structure, moving averages, support and resistance, volume, volatility, relative strength and other market-derived measures. By contrast, fundamental analysis studies information about the asset or the economic environment, such as revenue, profit margins, balance-sheet strength, interest rates, inflation, growth and valuation.
Those approaches answer different questions, so treating one as a universal replacement for the other creates unnecessary conflict. Fundamental analysis can help an investor decide what an asset may be worth and what conditions could change that estimate, while technical evidence can help describe how the market is currently pricing the asset and whether buyers or sellers are gaining control. An investor does not have to believe that every chart pattern predicts the future in order to find current price behavior informative.
Why trends can persist without becoming predictable
Markets do not need to be perfectly predictable for trends to exist. New information arrives unevenly, investors interpret the same information differently, large institutions cannot always build or unwind positions instantly, and people often respond to gains and losses in ways that reinforce an existing move for a time. A repricing process can therefore unfold over days, months or longer rather than being completed in one instant.
Positive feedback can also contribute to persistence. Rising prices attract attention, stronger relative performance can bring new buyers, and some systematic strategies explicitly increase exposure when market conditions strengthen. Falling prices can create the opposite pressure as risk limits are hit, leveraged positions are reduced, or investors who tolerated an initial decline decide they no longer want to hold the asset.
None of that means a trend creates its own permanent force. Every move eventually encounters new information, a change in valuation, a change in positioning, a shift in liquidity or simply enough opposing demand or supply to weaken the existing direction. The difficulty is that the turning point is obvious only after enough price movement has occurred to establish that something changed.
This is where the language of prediction can become misleading. Most trend-following methods are not really trying to forecast the exact price next month or identify the precise top and bottom. They are usually designed to remain aligned with an established direction while accepting that entries will be late, exits will be late, and some trades will reverse soon after the signal appears.
FINRA describes momentum investing as a form of market timing and emphasizes that unexpected economic, geopolitical and company-specific developments can change price direction rapidly. It also notes that momentum indicators can generate false signals, which is an important counterweight to any claim that recognizing a trend makes future returns easy to capture.[2] Trend information changes the evidence available to the investor, but it does not remove uncertainty.
How investors identify a trend
The simplest trend test is visual price structure. If an asset repeatedly makes higher highs and higher lows over the period that matters to the investor, the price structure is consistent with an uptrend. Lower highs and lower lows indicate a downtrend, while repeated reversals inside a relatively stable range suggest that neither side has established durable control.
A moving average provides another way to reduce the noise in daily prices. Instead of reacting to every change, the investor compares price with an average of prior prices, or compares a shorter moving average with a longer one. This does not make the signal predictive by itself. Smoothing simply makes a sustained change easier to see, and the cost of that clarity is delay because an average necessarily incorporates older data.
Price relative to a prior high, a long-term average or a broad market benchmark can also be informative. A stock that is rising but consistently lagging its sector may have weaker relative momentum than its own chart initially suggests. A broad index that remains in an uptrend while fewer stocks participate in the advance can likewise present a different risk picture from one in which gains are widely distributed.
Indicators can help formalize these observations, but adding more indicators does not automatically improve the analysis. Moving-average systems, rate-of-change measures, relative strength, trend-strength measures and volume tools are often derived from overlapping price data, so several indicators can appear to confirm one another while effectively repeating the same information. A small set of measures with clearly different purposes is usually easier to understand and test than a screen crowded with signals.
Modern charting software makes complex analysis accessible to individual investors, but ease of calculation should not be confused with quality of evidence. A rule can look persuasive on a chart because the settings were chosen after seeing the historical outcome. If a strategy only works with a narrow combination of parameters or requires frequent adjustment to keep its backtest attractive, the apparent precision may be a sign of overfitting rather than robustness.
The strongest trend analysis therefore begins with a question that exists before the indicator is chosen. An investor might want to know whether a long-term holding is still in a broad advance, whether a recent decline is large enough to alter the risk picture, or whether an asset is outperforming the market enough to justify a tactical allocation. The tool should answer that question consistently rather than generate a new decision every time the chart moves.
Reading a trend in the right timeframe
Timeframe is where investors and traders most clearly part company. A day trader may care about a move that lasts minutes, while a retirement investor with a multi-decade horizon may find the same movement meaningless. Both can be looking at the same asset and reach different conclusions without either analysis being internally inconsistent.
Investment timeframes matter because the holding period should influence the speed of the signal. If an investor expects to own a diversified equity allocation for many years, a rule that reacts to every short-term break will create far more trading than the investment objective requires. A much slower trend measure may be more coherent, even though it will react later to a genuine reversal.
There is no universally correct chart interval or moving-average length. Faster signals respond sooner but produce more false turns, while slower signals ignore more noise but give back more of a move before recognizing that the direction changed. This trade-off cannot be removed by finding a perfect indicator because responsiveness and stability pull in opposite directions.
The investor’s broader financial position matters as well. Investor.gov notes that asset allocation should reflect time horizon and risk tolerance, and that portfolios may need rebalancing when market movements push holdings away from the intended allocation.[3] A trend signal is therefore best interpreted inside a portfolio plan rather than in isolation, particularly when the money has a defined future use.
This is also why a long-term investor does not need to become a short-term trader simply to pay attention to trends. Monitoring can be infrequent and rule-based. A monthly or quarterly review can still identify whether the character of a long-running move has changed, whether risk has become concentrated, or whether a holding that once fit the portfolio now requires a closer fundamental review.
Using trends without turning investing into constant trading
The most practical use of trend information is often as a decision input rather than a complete investment system. A long-term investor might use a broad trend change as a reason to review position size, rebalance, revisit the investment thesis or examine whether risk has risen. That is different from automatically selling every asset that falls below a line on a chart.
Some investors do choose systematic trend-following rules, and the discipline can be valuable because the rule is defined before emotions become intense. A workable rule needs more than an entry signal. It also needs a clear measurement period, position size, exit condition, treatment of cash, policy for re-entry and an understanding of how much turnover the method is likely to create.
Online trading has made it inexpensive and fast to act on a market signal, which is helpful when a strategy genuinely requires action. The same convenience can make a weak process worse by encouraging an investor to react to every headline, intraday move or new indicator. The quality of a trend-based approach is determined more by the consistency of the rules and the quality of the risk controls than by the speed of the trading platform.
Transaction costs are only one friction. Taxable investors also have to consider the effect of realizing gains more often, and active strategies can create a behavioral cost when frequent decisions invite second-guessing. A strategy that appears to improve gross returns in a historical test may offer little advantage after realistic implementation costs are included.
Trend information can also support risk management without requiring an all-or-nothing move between stocks and cash. An investor can reduce an oversized position, stop adding to a weakening asset, tighten the criteria for new purchases, or rebalance toward the intended asset mix. These responses acknowledge changing market evidence without pretending that the next major move is known.
Going short deserves even more caution. A falling trend can create opportunities for traders who are equipped to take short exposure, but short selling, derivatives and leveraged inverse products introduce risks that are materially different from simply reducing a long position. A long-term investor does not need to profit from every decline in order to use a downtrend intelligently.
Where trend-based investing goes wrong
The first major problem is whipsaw. A signal turns negative, the investor sells, the market reverses, and the investor buys back at a higher price. Trend systems accept some of these losses as the cost of avoiding larger moves, but an investor who did not expect them may abandon the method after exactly the wrong sequence of trades.
Late entries and exits create another trade-off. A trend cannot be confirmed until some movement has already happened, so the investor necessarily gives up part of the beginning and often part of the end. Claims that a simple rule will reliably sell near market tops and buy near market bottoms should be treated skeptically because a rule sensitive enough to catch every early turn would also react to a great deal of ordinary volatility.
Behavioral inconsistency can undermine a sound rule. Investors may follow a sell signal during a frightening decline but hesitate to follow the re-entry signal because the news still looks bad, or they may ignore an exit because they have become attached to a winning investment. A systematic method only has meaning if the investor is prepared to follow the parts that feel uncomfortable as well as the parts that feel obvious.
Another risk is confusing a strong price trend with a low-risk investment. The opposite can be true near the later stages of a crowded move, when optimism is high, valuation is stretched and a large number of investors are positioned in the same direction. Trend strength describes the current movement; it does not tell you how painful a reversal could become.
Overconfidence is particularly dangerous because historical charts make past turning points look much clearer than they were in real time. Once the future path is visible, it is easy to believe that an exit would have been obvious or that a particular moving average “worked.” The relevant test is whether the rule was specified beforehand, whether it behaved reasonably across different markets and periods, and whether the investor could have followed it without hindsight.
There is also a difference between using trends and chasing performance. Buying an asset simply because it has risen sharply, without defining the period, the reason for entry or the conditions for exit, is not a disciplined momentum strategy. It is performance chasing, and the absence of an exit framework leaves the investor exposed when the move changes direction.
Combining market trends with fundamentals and portfolio discipline
Price trends are most useful when they improve the quality of a decision that already has an investment purpose. A fundamental investor can use trend deterioration as a prompt to ask whether the thesis has changed, whether expectations had become too optimistic, or whether the market is responding to information that has not yet been incorporated into the investor’s estimate. A technically oriented investor can use fundamentals to understand the economic exposure and valuation risk that a chart alone cannot reveal.
The same principle applies at the portfolio level. A broad market downtrend may justify a closer review of risk, but the response should depend on the investor’s goals, diversification, liquidity needs and ability to tolerate drawdowns. An investor with decades before the money is needed and a diversified allocation faces a different decision from someone who expects to draw heavily from the portfolio in the near future.
Trend analysis becomes more credible when the process is explicit. The investor should know which market is being measured, which timeframe matters, which signal counts as a change, what action follows, and what would cause the position to be restored. Without those rules, chart reading can become a way to rationalize whatever decision feels appealing after prices have already moved.
Investors should also be realistic about the objective. The aim does not have to be beating the market every year or avoiding every bear market. Trend information may be useful if it helps control concentration, keeps risk decisions consistent, prevents a speculative position from becoming a permanent holding by accident, or gives the investor a repeatable way to respond when market conditions change.
Ignoring price behavior completely throws away information, but treating every trend as a forecast creates a different problem. Markets can sustain direction for meaningful periods, and momentum research shows that persistence has appeared often enough to deserve attention, yet reversals, false signals and changing regimes are part of the same evidence. The useful middle ground is to treat trends as one measurable feature of the market and fit them to the investor’s horizon, risk limits and broader investment process.
Sources
- National Bureau of Economic Research: Profitability of Momentum Strategies: An Evaluation of Alternative Explanations
- FINRA: What Is Momentum Investing?
- U.S. Securities and Exchange Commission: Asset Allocation and Diversification