

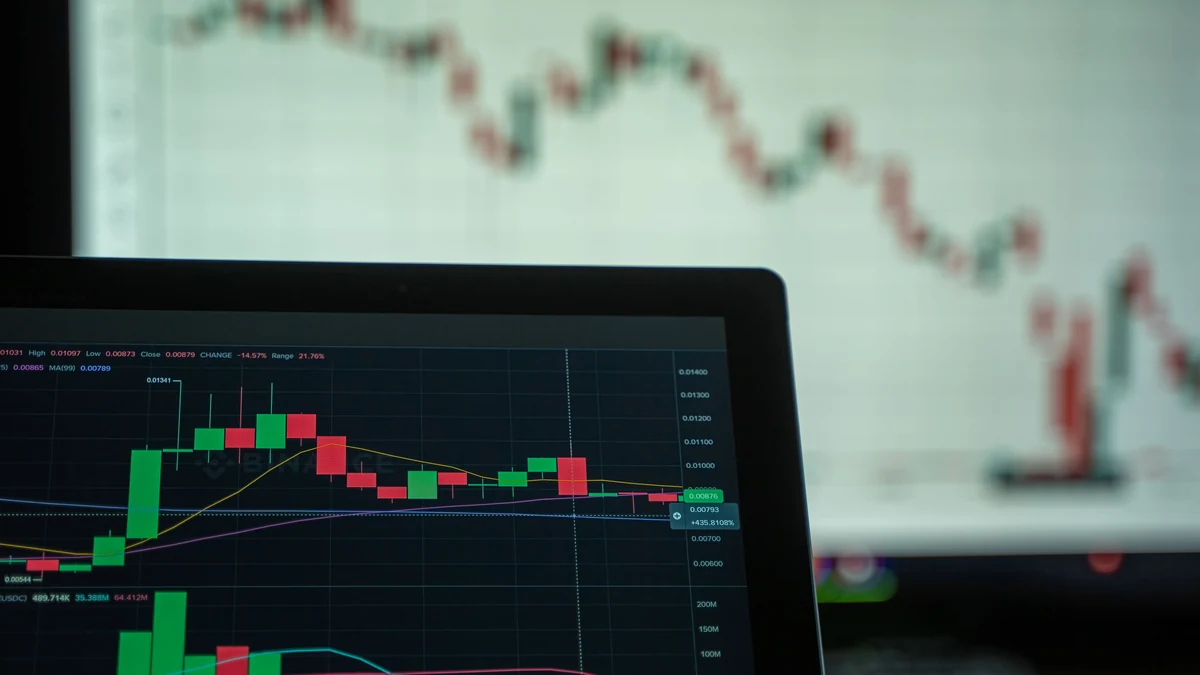
Technical analysis starts from a simple observation: a stock’s price and trading activity contain information about how buyers and sellers are behaving. Instead of beginning with revenue, margins, balance sheets, or estimated intrinsic value, the technical trader studies the market itself. Price, volume, volatility, and the sequence in which they change become the evidence used to decide whether a stock is trending, stalling, breaking out, reversing, or simply moving without a useful pattern.
That does not make technical analysis a mechanical way to predict the future. It is better understood as a framework for forming and testing trading hypotheses from observable market data. FINRA describes technical analysis as analysis based on patterns of prices or volume and notes that it can be used as part of market-timing strategies, which also carry the risk of higher trading costs and missed market moves.[1] The useful question is therefore not whether a chart can reveal the future with certainty, but whether a defined pattern or signal improves a trader’s decisions enough to justify acting on it.
Technical analysis studies market behavior, not business value
Fundamental and technical analysis begin from different types of evidence. fundamental analysis asks what a business may be worth based on its earnings, cash flows, assets, competitive position, and future prospects. Technical analysis asks what the market is doing with that information, along with everything else that is influencing supply and demand for the shares. A trader can use either approach independently, but they answer different questions.
The distinction matters because price can move before a fundamental change is obvious in a financial statement. Investors may react to expectations, new information, positioning, liquidity, or a shift in risk appetite long before the next quarterly filing appears. The opposite can also happen: a company may report apparently strong results while its share price weakens because expectations had already become more optimistic than the reported numbers justified. A chart does not explain every cause of a move, but it records the result of those competing judgments in the traded price.
Trading based on technical analysis therefore involves interpreting market behavior and connecting that interpretation to a defined entry, exit, and risk plan. The method is inherently concerned with speculating over future price movement, but speculation does not have to mean guessing. A technical rule can be stated in advance, applied consistently, and evaluated over many observations to determine whether it adds useful information.
Read the chart before adding indicators
A basic price chart already contains much of the information that technical indicators later summarize. The horizontal axis represents time, while the vertical axis represents price. A line chart usually plots closing prices, while bar and candlestick charts show more of the trading range by displaying the open, high, low, and close for each period. Changing the period from daily bars to hourly or weekly bars changes what the chart is designed to reveal.
The first task is to identify the market structure visible in the raw price series. A sustained sequence of higher highs and higher lows is commonly treated as an uptrend, while lower highs and lower lows suggest a downtrend. When neither side is establishing a persistent direction, price may be range-bound. These descriptions are simple, but they force the trader to distinguish a genuine directional move from ordinary noise before adding mathematical indicators that may make the chart look more sophisticated without making the decision clearer.
Trend and range require different expectations
Trend-following logic assumes that a move showing persistence may continue long enough to be traded. A trader might look for pullbacks within an uptrend, breakouts to new highs, or confirmation that a downtrend is still intact. Range trading uses almost the opposite assumption, expecting repeated movement between areas where buying and selling have previously become strong enough to turn price around.
The same chart pattern can therefore mean different things depending on context. A new high after months of rising prices may be a continuation signal, while a brief move above the top of a well-established range may fail if buyers do not sustain it. Technical analysis becomes more useful when the trader defines what evidence would confirm the interpretation and what price behavior would show that the interpretation was wrong.
Support, resistance, and breakouts are zones rather than guarantees
Support refers to an area where buying has previously been strong enough to slow or reverse a decline, while resistance describes an area where selling has previously constrained an advance. These levels are often drawn from prior highs and lows, price gaps, consolidation zones, or other points where trading activity visibly changed. They are usually better treated as areas than as exact prices because real orders are distributed across different levels and market conditions change continuously.
A breakout occurs when price moves beyond an established boundary, but the move itself is not enough to establish that a new trend has begun. Some breakouts continue, some reverse quickly, and others produce only a small extension before price settles into another range. Traders often look at closing prices, volume, follow-through, and the behavior after a retest to judge whether a breakout has attracted enough participation to matter.
Volume, liquidity, and volatility change the meaning of price
Price shows where transactions occurred, while volume shows how much trading took place. A sharp price move accompanied by unusually heavy volume can indicate broader participation than the same move on light activity, although volume is not a universal confirmation signal. A stock can continue rising on declining volume, and a sudden surge in volume can occur at the end of a trend as well as near its beginning.
Liquidity is more practical because it affects whether a technical setup can be executed close to the prices shown on the chart. Thinly traded stocks can have wide bid-ask spreads, abrupt gaps, and shallow order books, so a visually attractive pattern may be difficult to trade at the expected price. The shorter the strategy’s time horizon and the smaller the expected gain, the more important those execution costs become.
Volatility describes how widely prices move over a period. High volatility creates larger opportunities and larger adverse moves, while low volatility can make short-term targets harder to reach. A trader should not automatically prefer volatile stocks; the useful question is whether the typical movement is large enough to justify the trade while still allowing the position size and stop distance to remain within the trader’s risk limit.
Indicators compress price data but do not create information
Technical indicators transform price or volume into another series intended to make a feature easier to see. A moving average smooths price and can help show direction. Momentum oscillators such as the relative strength index compare recent gains and losses to indicate how strongly price has been moving, while indicators such as MACD compare moving averages to highlight changes in trend and momentum. Each tool rearranges market data rather than introducing new information about the company.
That distinction helps prevent a common error: adding several indicators that are all derived from the same prices and then treating their agreement as several independent confirmations. Two moving-average systems, an oscillator, and a trend indicator may all respond to the same underlying move. A cleaner chart with one or two well-understood tools can provide more disciplined information than a screen covered with overlapping signals whose statistical relationships the trader has never tested.
Indicators also behave differently in different market regimes. A trend-following signal can work well during persistent directional moves and then produce repeated false entries in a sideways market. An oscillator designed to identify stretched moves within a range can keep signaling that a strongly trending stock is overbought or oversold for much longer than a trader expects. The tool must match the behavior being traded rather than being treated as a universal buy or sell command.
Time frame is part of the signal
A stock can be in an uptrend on a weekly chart, a downtrend on a daily chart, and a short-term rebound on an hourly chart at the same time. Those observations are not contradictory because each chart is measuring a different slice of price behavior. A signal only has meaning relative to the time frame that generated it and the holding period for which it is intended.
This is why the desire to time our trades and get an advantage needs to begin with a specific horizon. A two-day breakout system should not be judged against a five-year investment outcome, and a weekly trend signal should not be abandoned because of an ordinary intraday reversal. Entry rules, stop placement, target distance, and the amount of noise that can be tolerated all depend on how long the strategy is designed to stay in a position.
The same distinction applies when planning on holding a stock long term. Long-horizon technical analysis can use weekly or monthly data to identify major trends, but a longer holding period does not make chart-based decisions automatically safer. A large decline can persist for months, and a concentrated position remains exposed to company-specific risk regardless of how slowly the chart is observed.
Technical signals need rules, not interpretive flexibility
A useful technical setup can be described before the trade occurs. The trader should know what creates the setup, what confirms an entry, where the idea is invalidated, and what will cause the position to be reduced or closed. Without those rules, chart analysis can become a retrospective exercise in which every move appears obvious after it has already happened.
Objectivity is particularly important with visual chart patterns. Research by Andrew Lo, Harry Mamaysky, and Jiang Wang used algorithmic definitions to examine patterns such as head-and-shoulders and double bottoms across U.S. stocks. They found that some patterns contained incremental information in their historical sample, while also emphasizing the subjectivity that arises when patterns are identified visually and the distinction between statistical information and actual trading profitability.[2] That is a stronger foundation for technical analysis than claiming that recognizable shapes reliably predict prices.
A trader does not need to automate a strategy to make it testable, but the rules should be precise enough that two people applying the same method would usually reach the same conclusion. If a support level can be redrawn after every losing trade, or a breakout is valid only when the trader likes the result, there is no stable strategy to evaluate. Flexibility is useful when market conditions change, but it should come from an explicit decision process rather than from moving the criteria after the fact.
Historical testing is useful but easy to overfit
The performance of a stock provides a record on which technical rules can be studied, but historical success is not proof that the same rule will continue working. A strategy can appear excellent simply because it was designed around the specific data used to test it. The more indicators, thresholds, time periods, and exceptions a trader tries, the easier it becomes to find a combination that fits the past by chance.
A stronger test separates the process of creating the strategy from the process of evaluating it. Traders can examine how a rule behaves across different stocks, sectors, and market conditions, then reserve later data for a test that was not used to design the rule. Trading costs, spreads, missed fills, and realistic execution assumptions should be included because a small theoretical advantage can disappear once the strategy is implemented.
The size of the sample matters as well. Five successful trades do not establish that a method has an edge, especially when the expected payoff per trade is highly variable. A strategy should be judged by the distribution of wins, losses, drawdowns, and outcomes across enough observations to show how it behaves when conditions are favorable and when they are not. The goal is not to prove that a pattern always works, but to estimate whether its average behavior is useful enough to trade.
Market and sector context can strengthen or weaken a setup
Individual stocks are influenced by broader forces. A strong stock can weaken when its sector is being sold, and a mediocre company can rise during a broad rally that lifts most risk assets. Technical traders therefore often compare the individual chart with a market index, sector index, or closely related peers to understand whether the move is company-specific or part of a larger flow of money.
Macroeconomic expectations can also change the background against which a chart develops. Interest rates, inflation, growth expectations, and the prevailing economy can affect valuations and investor risk appetite across many companies at once. Traders may also follow economic indicators, although technical analysis itself focuses on how those influences are reflected in price and volume rather than attempting to value the business directly from the macro data.
Relative strength can help separate a stock from its background. A stock that holds near its highs while the market declines may be showing stronger demand than its peers, while a stock that repeatedly fails to participate in a broad rally may be revealing weakness. Relative behavior is not a guarantee of the next move, but it gives the trader another way to frame what buyers and sellers are doing compared with the opportunities available elsewhere.
Fundamental and technical analysis can be combined
There is no requirement to choose one analytical philosophy for every decision. A trader can use fundamental work to identify companies whose earnings or valuation outlook appears attractive, then use technical analysis to determine whether price behavior supports an entry. Another trader may begin with a technical screen and then review the business to avoid taking a position that depends on a fragile balance sheet or an event risk the chart does not reveal.
The two approaches also operate on different information sets. Fundamentals can explain why an investment thesis may deserve to work over time, while technical evidence can show whether the market is currently rewarding or rejecting that thesis. When the two disagree, the conflict can be informative rather than inconvenient. A fundamentally attractive company with persistent price weakness may simply be early, but it may also indicate that the market is responding to information or expectations the trader has not incorporated.
Securities also differ in liquidity, leverage, trading hours, settlement, and the way prices respond to underlying markets. A charting technique that appears transferable across asset classes should therefore be adapted to the instrument being traded. The visual language of trends and momentum may look similar, but execution risk and payoff structure can differ substantially.
Risk management turns a signal into a trade
A technical signal says little about how much money should be committed. Position size should reflect the distance to the point where the setup is invalidated, the amount the trader is prepared to lose, and the volatility of the stock. A very tight stop combined with an oversized position can create more practical risk than a wider stop with a smaller position, even when the chart pattern is identical.
Stops should be connected to the thesis rather than placed at an arbitrary percentage because a convenient round number may sit inside normal market noise. A trader buying a breakout might decide that a sustained return below the breakout area invalidates the setup, while someone buying a pullback may use the loss of a prior swing low. The exact rule can vary, but the exit should have a relationship to the reason for entering the trade.
Frequent trading adds another layer of risk because repeated transactions create costs and increase the number of opportunities for execution errors and poor decisions. FINRA warns that frequent intraday trading can bring higher costs that erode returns and requires close attention to market dynamics, account rules, and risk, particularly when margin is involved.[3] A technical strategy should therefore be judged on net results after realistic costs rather than on the gross movement between chart points.
Common failures come from the process, not the chart
One failure is seeing patterns everywhere. Human perception is good at finding shapes, and a trader who stares at enough charts can always identify a trendline, head-and-shoulders pattern, divergence, or support level after the fact. The safeguard is to define the pattern before looking at the outcome and to accept occasions when the chart simply offers no high-quality setup.
Another problem is changing time frames to protect an existing opinion. A losing short-term trade can suddenly become a “long-term investment” when the stop is reached, while a long-term position can be judged from a five-minute chart during a stressful decline. The analysis should remain anchored to the horizon and rules chosen before the trade unless new information provides a genuine reason to redesign the strategy.
Indicator stacking creates a different form of false confidence. If five indicators are all functions of the same price history, their agreement can look like strong confirmation even though the signals are highly correlated. Traders are usually better served by understanding what each indicator measures, why it belongs in the process, and whether it adds information that is not already visible in the price action.
Recency bias can also make a strategy seem more reliable than it is. A trend system tested during a strong bull market may look unusually effective, while the same system can struggle during extended sideways trading. The evaluation should include periods with different volatility, direction, and liquidity conditions so the trader knows which environments are likely to produce the largest drawdowns.
A practical technical-analysis process
A disciplined process begins by deciding what kind of move is being sought and over what period. The trader can then identify liquid stocks that fit the strategy, establish the market and sector context, and examine the raw chart before adding indicators. The chart should reveal whether the stock is trending, ranging, breaking out, or behaving too erratically for the method being used.
The next step is to define the exact conditions for entry and invalidation. If an indicator is used, its role should be clear rather than decorative. Volume, volatility, and the expected spread should be checked against the intended holding period, and position size should be calculated from the amount at risk rather than from how strongly the trader feels about the setup.
After the trade is closed, the result should be recorded in a way that separates process from outcome. A profitable trade taken outside the rules can still represent poor discipline, while a properly executed losing trade can be consistent with a strategy that has a positive expectation over many attempts. Reviewing the same information across a meaningful sample helps reveal whether the method is behaving as expected or whether its assumptions need to be reconsidered.
Technical analysis is most useful when it stays testable
Technical analysis offers a structured way to study how a stock is actually trading, but its value comes from disciplined interpretation rather than from the visual appeal of charts. Trends, support and resistance, momentum, volume, and indicators are useful only when they are connected to a specific time horizon, a repeatable rule, and a realistic assessment of trading costs and risk.
The strongest technical process accepts uncertainty from the beginning. It does not assume that past patterns must repeat, and it does not require every trade to be profitable. It asks whether the observed market behavior provides enough evidence to justify a position, whether the risk is acceptable if the interpretation fails, and whether the strategy continues to perform when tested beyond the examples that originally made it look attractive.
Sources
- FINRA: What Is Market Timing?
- National Bureau of Economic Research: Foundations of Technical Analysis: Computational Algorithms, Statistical Inference, and Empirical Implementation
- FINRA: Frequent Intraday Trading: Understanding the Basics