GameStop Posts Record Q2 Operating Income as Collectibles Reach 45% of Sales
Collectibles sales rose 57% to $356.3 million even as total revenue fell, while GameStop lifted full-year adjusted EBITDA guidance above $650 million.
Our editorial standards
MarketReview publishes clear, independently produced financial information using reliable sources and transparent editorial standards.
Read our Editorial Policy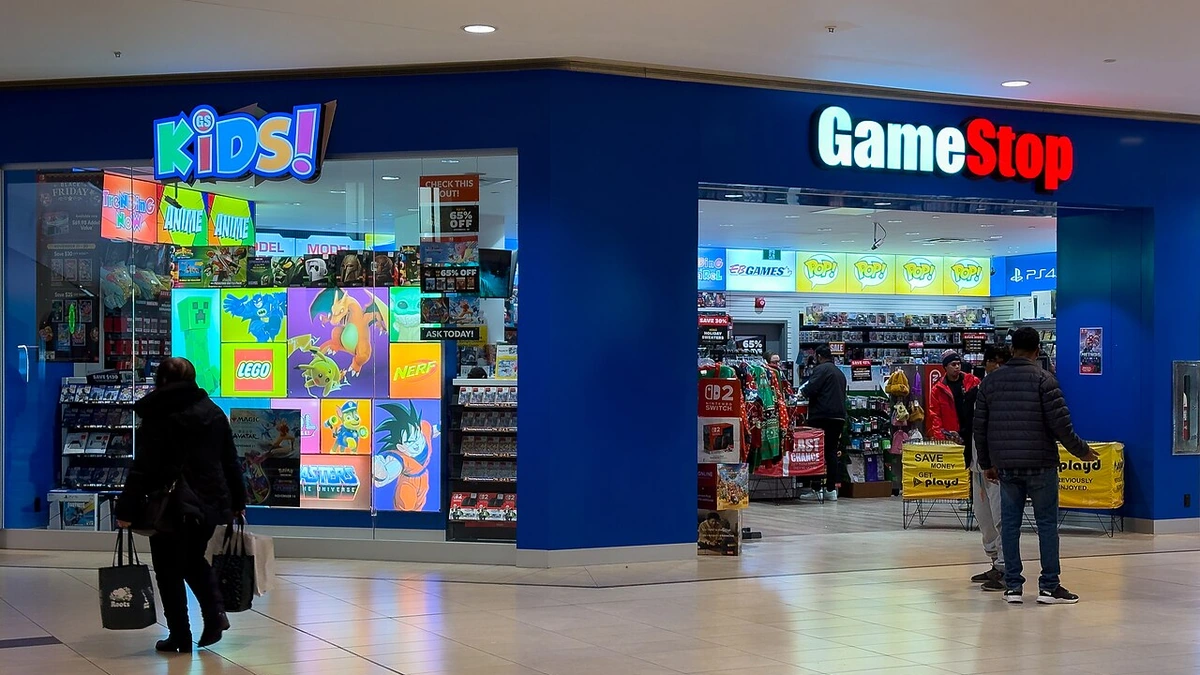
GameStop posted $160.2 million of operating income for its second quarter ended Aug. 1, the highest second-quarter operating income in the company’s history, as collectibles sales climbed 57% from a year earlier to $356.3 million. Collectibles accounted for 45.1% of quarterly net sales, nearly double their 23.4% share in the comparable period last year.
The record operating result came despite a sharp contraction in the top line. Net sales fell to $790.2 million from $972.2 million a year earlier. Net income increased to $298.7 million from $168.6 million, although investment-related gains and losses on digital assets had a large effect on the GAAP bottom line. Adjusted net income, which excludes those and other specified items, rose more modestly to $161.1 million from $138.3 million.
GameStop’s SEC-filed earnings release also showed gross profit rising to $345.0 million from $283.1 million even as revenue declined. Selling, general and administrative expenses fell to $187.1 million from $218.8 million, helping push adjusted operating income to $158.7 million from $64.7 million. Adjusted EBITDA more than doubled to $174.0 million from $75.7 million.
Collectibles become GameStop’s largest sales category
The shift in the sales mix was one of the clearest changes in the quarter. Collectibles generated $356.3 million, compared with $263.2 million from video games and $170.7 million from pre-owned and refurbished products. That put collectibles at 45.1% of sales, ahead of video games at 33.3% and pre-owned and refurbished products at 21.6%.
Beginning with the second quarter, GameStop changed how it reports its sales categories to reflect the way management says it now views and operates the business. The company presents sales in three groups: Collectibles, Video Games, and Pre-Owned and Refurbished. Prior-year amounts were recast to make the comparison consistent. Collectibles include new and pre-owned trading cards, figures, apparel, toys and other products for gaming and pop-culture enthusiasts, along with fees earned from facilitating third-party authentication and grading of customers’ trading cards.
The first-half numbers show that the collectibles shift was not confined to one quarter. For the 26 weeks ended Aug. 1, collectibles sales totaled $705.2 million, or 43.4% of net sales, compared with $439.1 million and 25.7% of sales in the prior-year period. Video game sales over the same six months fell to $549.8 million from $844.8 million, while pre-owned and refurbished sales declined to $370.5 million from $420.7 million.
GameStop attributed the overall second-quarter sales decline primarily to the prior-year launch of Nintendo Switch 2, planned store closures and the divestiture of its France operations. The comparison therefore combines a weaker video-game sales period with a smaller retail footprint and a rapidly expanding collectibles business. The company did not disclose gross profit by merchandise category, so the release does not establish how much of the quarter’s margin improvement came specifically from collectibles.
Higher gross profit and lower expenses lift operating earnings
The profit improvement was visible before the company’s investment activity entered the income statement. Gross profit increased by $61.9 million year over year, and gross margin rose to 43.7% of net sales from 29.1%. At the same time, SG&A expenses declined by $31.7 million. Those changes helped raise the operating margin to 20.3% from 6.8% even though net sales were $182.0 million lower.
Adjusted operating income was close to the GAAP result, at $158.7 million compared with reported operating income of $160.2 million. A year earlier, adjusted operating income was $64.7 million against a GAAP figure of $66.4 million. The relatively small gap between the two measures makes the quarter’s operating improvement distinct from the much larger adjustments that affected net income below the operating line.
Most of the operating profit came from the United States segment. U.S. operating income rose to $153.2 million from $63.7 million even as U.S. net sales fell to $608.2 million from $724.6 million. Australia generated $8.1 million of operating income, up from $6.0 million, on sales of $120.9 million. Europe reported a $1.1 million operating loss, narrower than the $3.3 million loss a year earlier, as sales fell to $61.1 million from $106.7 million.
Below operating income, the quarter included a $166.3 million gain on a derivative asset and a $72.1 million unrealized gain on an equity investment, partly offset by a $75.0 million loss on digital assets and related receivables. Interest income contributed another $77.1 million. GameStop’s adjusted net income removes those and other specified items, which is why the adjusted figure of $161.1 million was far below GAAP net income of $298.7 million.
Cash generation did not rise in tandem with reported earnings. Net cash provided by operating activities was $62.4 million for the quarter, down from $117.4 million a year earlier. After $1.7 million of capital expenditures, GameStop reported free cash flow of $60.7 million, compared with $113.3 million in the prior-year quarter. Free cash flow is a company-defined non-GAAP measure and should be considered alongside the GAAP cash-flow statement.
Full-year EBITDA outlook rises above $650 million
GameStop raised its fiscal 2026 adjusted EBITDA outlook to more than $650 million for the year ending Jan. 30, 2027. That is above the more-than-$600-million outlook issued on June 26. The company reported $339.7 million of adjusted EBITDA for the first six months of the fiscal year, compared with the $345.4 million it generated in all of fiscal 2025.
The balance sheet has also changed substantially. At Aug. 1, GameStop held $5.4 billion of cash, cash equivalents, marketable securities, digital assets and related receivables. Of that total, $5.1 billion was cash, cash equivalents and marketable securities, and $0.3 billion was digital assets and related receivables. Separately, the company held approximately 43.4 million shares of eBay common stock with a fair value of about $4.9 billion.
After the quarter closed, GameStop completed privately negotiated exchanges on Sept. 3 that retired about $1.4 billion of principal amount across its 0% convertible senior notes due in 2030 and 2032. The company said the exchanges reduced total long-term debt to approximately $2.8 billion. That capital-structure change is subsequent to the Aug. 1 balance-sheet date, so it is not part of the quarter-end debt figure itself.
The raised outlook sets a concrete second-half benchmark. With $339.7 million of adjusted EBITDA recorded in the first half, GameStop would need to generate more than $310.3 million in the second half to finish above the new $650 million threshold. The company does not provide a GAAP net-income reconciliation for the forward adjusted EBITDA target because it says certain future items cannot be predicted without unreasonable effort.
More News



Latest News
View all news- JPMorgan Reports $15.3 Billion Third-Quarter Profit as Revenue Hits $50.2 Billion
- Johnson & Johnson Raises 2026 Sales Outlook After $25.4 Billion Third-Quarter Revenue
- IMF Raises Global Growth Forecast to 3.1% as AI Investment Supports the U.S. Outlook
- Goldman Sachs Posts $5.29 Billion Q3 Profit and $17.01 Earnings Per Share
- FTC Seeks Contempt Sanctions Against Martin Shkreli Over Alleged Biotech Stock Trading