

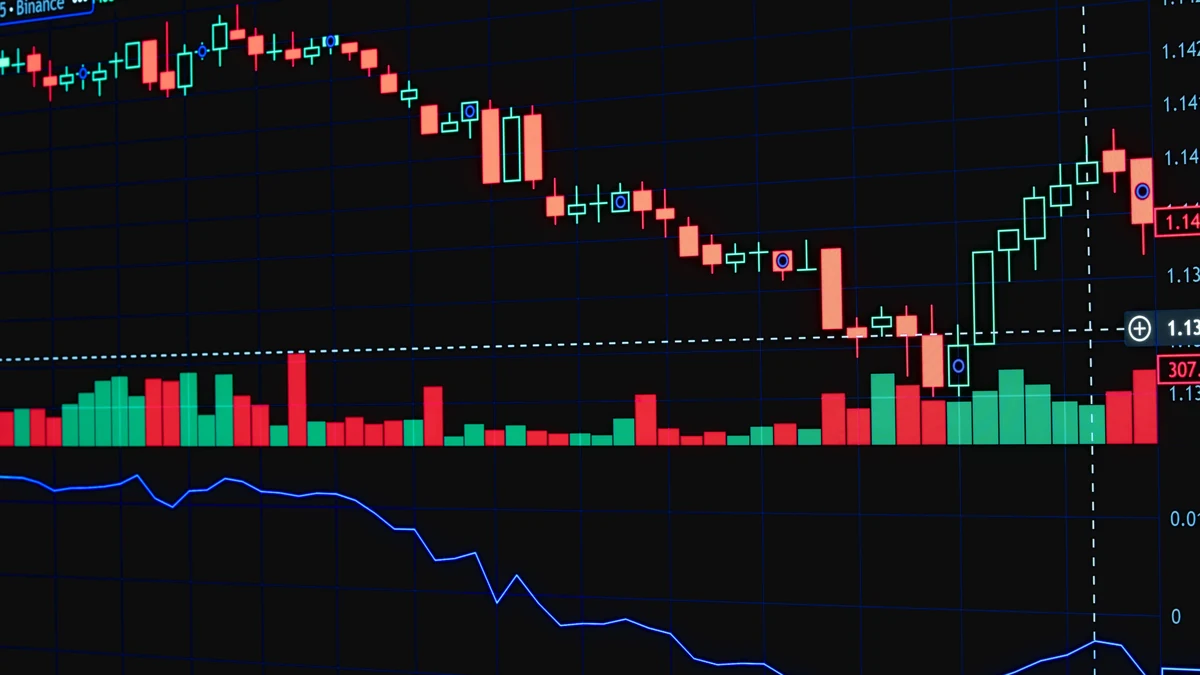
Technical analysis in commodity markets is the study of price behavior and related market data to help decide when a trade may be attractive, when it is losing its case, and how risk should be managed. It does not require the trader to believe that charts reveal the future with certainty. The practical purpose is narrower: organize observable market behavior into a repeatable decision process instead of relying on an unstructured reaction to every price move.
That distinction matters because commodity prices are shaped by real-world forces that charts do not explain on their own. Weather, inventories, production, transportation, policy and changes in demand can all move a market, yet traders still have to decide how those developments are being reflected in price. Someone holding gold for years may care little about a one-day chart pattern, while a futures trader may need a much more precise entry, exit and risk level because the position is leveraged and time-limited.
Technical analysis is therefore best understood as one layer of a trading process rather than as a competing belief system. CME Group’s technical-analysis education covers chart reading, trend and reversal patterns, support and resistance, moving averages and oscillators, which reflects the breadth of tools commonly used by market participants.[1] The useful question is not whether one indicator is universally superior, but whether the chosen method fits the commodity, time frame and type of trade being considered.
What technical analysis is trying to measure
When people discuss trading commodities, technical analysis often gets reduced to chart patterns or indicator signals. In practice, it is a broader attempt to describe how price is behaving. A trader may be trying to determine whether a market is trending, rotating inside a range, accelerating, losing momentum or repeatedly rejecting a particular price area.
Price contains information because every completed trade reflects a buyer and seller agreeing on a transaction at that moment. A chart cannot tell you why each participant acted, and it cannot distinguish a well-informed order from an emotional one, but it does show the result of all those decisions. Technical analysis works with that observable result, which is why it can be useful even when the underlying cause of a move is unclear.
The limitation follows from the same logic. Historical price movements do not create a law that future prices must obey. A level that held several times can break, a strong trend can reverse after new information, and an indicator that worked well in one period can deteriorate when volatility or market structure changes. Technical analysis provides a framework for making conditional decisions, not a guarantee that a repeated pattern will repeat again.
Reading trend, support and resistance
Trend is one of the most basic ideas in technical analysis because it changes the meaning of almost every other signal. A market making a persistent series of higher highs and higher lows is behaving differently from one that repeatedly reverses inside the same price area. Traders may describe the first environment as trending and the second as range-bound, but the labels are only useful when they affect how a position is planned.
Support and resistance are price areas where buying or selling has previously been strong enough to slow or reverse movement. They are better treated as zones than as perfectly precise numbers because futures markets trade continuously and orders are distributed across many prices. A previous high, low, settlement area or heavily traded region may become important again, but there is no requirement that the market respect it.
Breakouts illustrate why context matters. A move above resistance can signal that buyers are willing to transact at prices that previously attracted selling, yet a brief move above the level can also fail and reverse. Traders often look for additional evidence such as follow-through, increased participation, a retest of the broken area or alignment with a broader trend rather than assuming that crossing a line automatically validates the trade.
Moving averages are context, not forecasts
Moving averages smooth a series of past prices, making it easier to see the direction of a market without giving equal visual weight to every short-term fluctuation. A simple moving average gives each observation in its lookback period the same weight, while an exponential moving average puts more weight on recent data. Either can help a trader compare current price with a recent average or compare shorter and longer market tendencies.
The danger is treating the average as if it possesses predictive power by itself. A moving average is calculated from prices that have already occurred, so every crossover or change in slope is necessarily based on past data. In a persistent trend, that lag may be acceptable because the trader is trying to stay with a move rather than call its exact beginning, but in a choppy market the same method can produce repeated entries and exits with little progress.
Moving-average settings should therefore follow the job the indicator is meant to perform. A short lookback responds quickly but also reacts to more noise, while a longer lookback moves slowly and can keep the trader in a trend longer. The trade-off is not solved by finding a magical period; it is managed by choosing a setting that matches the holding period and then testing whether the resulting signals are useful after realistic trading costs.
Time frame changes the signal
The same commodity can look bullish on a daily chart, neutral on an hourly chart and bearish over the last few minutes. Those observations are not necessarily contradictory because each time frame summarizes a different portion of the market’s behavior. Problems arise when a trader enters using one time frame and then changes to another after the trade moves against the position.
A short-term trader may use a longer chart to understand the broader environment and a shorter chart to refine execution, but the risk level still needs to match the horizon of the trade. If a position was opened because of a five-minute setup, a loss should not automatically be reclassified as a long-term investment because the weekly chart still looks favorable. Commodity futures expire, and leverage can make that kind of improvisation particularly costly.
Momentum, oscillators and the danger of overconfidence
Momentum indicators try to describe the speed or strength of price movement rather than simply its direction. Common examples include the relative strength index, stochastics and MACD. These tools can help show whether a move is accelerating, weakening or becoming extended relative to recent behavior, but their output is still derived from price data and should not be mistaken for independent confirmation from a separate source.
The familiar language of overbought and oversold is especially easy to misuse. An oscillator at an elevated reading does not mean the commodity must fall, just as a low reading does not require an immediate rally. Strong trends can keep an indicator at an extreme for longer than a trader expects, so using an oscillator as an automatic reversal signal can lead to repeated positions against a market that is still moving forcefully in one direction.
Divergence can be more informative when it is treated as evidence of changing momentum rather than as a forecast. If price makes a new high while a momentum measure fails to confirm it, the move may be losing strength, but the divergence itself does not specify when a reversal will occur. A trader still needs a price-based trigger, a level that invalidates the idea, or some other condition that turns the observation into a trade plan.
The same caution applies to other indicators. Adding more indicators does not necessarily add more information, especially when several are different mathematical transformations of the same price series. A screen filled with correlated signals can create an illusion of confirmation while all of them are responding to essentially the same underlying move.
Volume and open interest add futures-market context
Commodity futures provide data that can complement price charts. Trading volume measures how many contracts changed hands during a period, while open interest measures how many contracts remain open rather than having been offset or closed. CME Group distinguishes the two by noting that volume counts contracts traded and open interest represents contracts that remain outstanding.[2]
Those measures can help a trader judge participation, but they do not reveal the full intent behind the transactions. Rising volume during a breakout may show that the move attracted more activity, yet the data does not tell you that every participant agrees with the direction or that the breakout will continue. Open interest can increase because new long and short positions are being created together, which is why its interpretation has to be tied to price behavior rather than treated as a directional vote.
Changes around contract expiration also require care. Activity migrates from an expiring futures contract into a later month, which can sharply change volume and open interest in individual contracts without representing a sudden change in the underlying commodity outlook. Traders comparing historical charts should know whether they are looking at a single contract, a continuous futures series or another data construction, because roll conventions can alter what the chart appears to show.
Technical and fundamental analysis answer different questions
The old debate between technical and fundamental analysis often presents the two as mutually exclusive. They are better understood as methods that emphasize different information. Fundamental analysis asks what may be changing in supply, demand, inventories, production costs or other economic drivers, while technical analysis asks how the market is currently responding in price and trading behavior.
A fundamental thesis can be correct and still produce a poor trade if the timing is wrong or the information is already reflected in the contract price. A technical setup can also work temporarily even when the trader has no strong view about the underlying cause. Neither observation proves that one method is inherently easier, and neither removes the need to decide how much risk to take if the market behaves differently from the thesis.
Commodity markets make the interaction particularly important because scheduled information can abruptly change expectations. Government crop reports, energy inventory releases, weather forecasts, production decisions and macroeconomic data can move futures prices quickly. A chart may show where the market has been trading before an announcement, but it cannot know the contents of information that has not yet been released.
For that reason, some traders use fundamentals to define the environment and technical analysis to manage execution. Others trade primarily from price but avoid taking new risk immediately before events that can overwhelm normal chart behavior. The appropriate combination depends on the strategy, but the useful principle is the same: a technical signal should be interpreted in the context of the market in which it appears.
Commodity markets do not all behave the same
Different commodities markets have different liquidity, seasonal patterns, trading hours, contract sizes and sensitivities to news. Agricultural markets can react sharply to weather and crop expectations, energy markets can move on inventories and geopolitical developments, and metals may respond to currency, interest-rate and industrial-demand changes. A technical method that looks stable in one market can perform very differently in another.
Even comparisons with the forex market need care. Both currencies and commodity futures can trade around the clock for much of the business week, but their contract structures, liquidity patterns and fundamental drivers are not identical. Borrowing a strategy from another asset class without re-examining its assumptions can create false confidence, especially if the strategy was optimized around a different level of volatility or transaction cost.
Volatility also changes over time within the same commodity. A stop that was generous during a quiet month may be too tight when daily ranges expand, while a position size that was manageable in normal conditions may become excessive after a volatility shock. Traders who use fixed dollar stops or fixed contract counts without accounting for changing market movement can unintentionally take very different amounts of risk from one trade to the next.
Seasonality deserves similar restraint. Some commodities have recurring production and demand cycles, but a seasonal tendency is an average drawn from past observations, not a promise about a particular year. Weather, inventories, policy and unexpected supply disruptions can dominate the historical pattern, so seasonality is more useful as context than as a standalone entry signal.
Turning a chart idea into a trade plan
A chart observation becomes a trading strategy only when it is connected to explicit decisions. The trader needs a condition for entry, a reason the idea would no longer be valid, a position size that makes the possible loss tolerable and a method for managing a favorable move. Without those elements, technical analysis can become a collection of attractive explanations applied after the fact.
Entry rules should be specific enough that the trader can distinguish a valid setup from a near miss. If the idea is based on a breakout, the rule might require a close beyond a defined area rather than a momentary trade through it. If the idea is mean reversion, the trader may require evidence that price has stopped extending and begun to move back into the prior range before assuming that an oscillator extreme has mattered.
Exit logic is equally important because no indicator eliminates false signals. A technical level can provide a natural place to recognize that the market is not behaving as expected, but the distance to that level should influence position size. A wider stop paired with the same number of contracts creates more dollar risk, so risk should be measured from the trade structure rather than from the amount of margin required to open the position.
Leverage makes risk control non-negotiable
Futures margin allows a trader to control a contract whose notional value is much larger than the cash posted to support it. That efficiency is useful, but it also means a move that looks modest on a chart can produce a large gain or loss relative to account equity. The CFTC warns that speculative short-term trading is risky and emphasizes the added danger of combining unfamiliar markets with leverage; it also advises traders to use risk capital and to build their own trading plan rather than rely on promised signals.[3]
A stop order can help enforce a loss limit, but it does not guarantee execution at the exact stop price. Fast markets, overnight moves and gaps around important news can produce slippage, and some contracts become less liquid at particular times of day or as expiration approaches. Position sizing needs enough room for those realities instead of assuming that every exit will occur at the intended price.
Risk control also protects the trader from the temptation to reinterpret a losing trade. If the original technical reason for the position disappears, adding more contracts simply because the price is now cheaper changes the strategy. There are legitimate scaling methods, but they should be defined before the trade and supported by capital sufficient for the full planned exposure rather than invented after the market moves against the position.
What technical analysis cannot do
Technical analysis cannot tell a trader what a commodity is fundamentally worth in the way a cash-flow model attempts to value a business. Commodities do not produce earnings, and futures prices reflect expectations about delivery, carrying costs, supply, demand and market conditions. A chart can identify where participants have traded, but it cannot establish an intrinsic value that the market must eventually reach.
It also cannot remove event risk. A carefully formed pattern can fail immediately after an unexpected production announcement, weather change, geopolitical shock or policy decision. The fact that the pattern failed does not prove that technical analysis is useless; it demonstrates that a price-based model is operating in a market where new information can change the distribution of possible outcomes.
Backtesting does not solve the problem automatically either. A strategy can look impressive when its parameters are selected after examining the historical data, especially if many variations were tested and only the best result was kept. Traders should be suspicious of methods that depend on very specific settings, ignore transaction costs or produce most of their historical profit from a small number of unusual periods.
Technical analysis is most credible when it is used to make a process more explicit and testable. If a method has clearly defined rules, the trader can examine when it tends to work, when it fails, how large the losses are and whether the return survives realistic costs. If the method changes every time the market produces an inconvenient result, the chart has become a story rather than a discipline.
Using technical analysis with discipline
A practical approach starts with the market rather than the indicator. The trader first decides what commodity and contract are being traded, how liquid the contract is, what time horizon matters and whether important scheduled events fall inside the planned holding period. Only then does it make sense to choose technical tools that answer a specific question about trend, momentum, volatility or entry timing.
The next step is to connect the observation to risk. A support level is useful only if the trader knows what will happen if it breaks, and a momentum signal is useful only if the position size reflects the distance to the point where the setup no longer makes sense. Technical analysis is strongest as a decision framework because it can make those conditions visible before money is committed.
Commodity traders do not need to choose between understanding the physical market and reading the chart. The two perspectives can coexist, and each can expose weaknesses in the other: fundamentals can explain why a move may have room to continue, while price behavior can show that the market is not responding as the thesis expected. The objective is not to predict every turn, but to take trades for identifiable reasons and to know in advance what evidence would require a different decision.
Sources
- CME Group: Technical Analysis
- CME Group: Open Interest
- Commodity Futures Trading Commission: Customer Advisory: Understand Risks and Markets before Reacting to Internet Hype