Canadian Producer Prices Rise 1.3% in August as Raw-Material Costs Jump 3.1%
Energy and petroleum products led the monthly increase in factory-gate prices, while crude energy costs drove the sharper rise in manufacturers' raw-material inputs.
Our editorial standards
MarketReview publishes clear, independently produced financial information using reliable sources and transparent editorial standards.
Read our Editorial Policy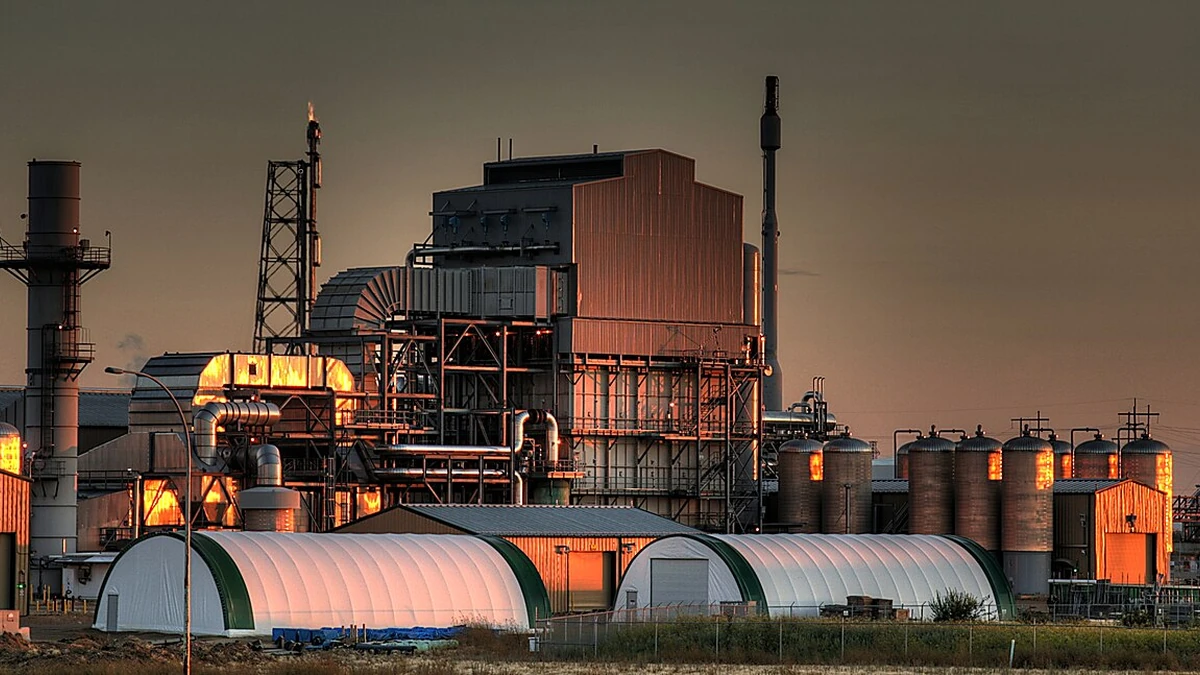
Canadian producer prices rose in August as higher energy, petroleum and metal prices pushed up factory-gate costs, while raw-material prices increased even more sharply. The Industrial Product Price Index, or IPPI, rose 1.3% from July, and the Raw Materials Price Index, or RMPI, climbed 3.1%.
On a year-over-year basis, producer prices were 13.5% higher than in August 2025, while raw-material prices were up 22.8%. The monthly gains followed a 0.3% rise in the IPPI in July and three consecutive monthly declines in crude-energy raw-material prices before August.
Statistics Canada said in its September 17 release that energy and petroleum products were the largest contributor to the monthly increase in producer prices. The agency also said crude energy products were the main driver of the rise in raw-material prices. Both indexes are not seasonally adjusted.
Energy and petroleum products lead the factory-gate increase
Energy and petroleum product prices rose 4.0% in August after increasing 6.2% in July. Refined petroleum energy products gained 4.6%, with diesel fuel up 9.6% and light fuel oils up 8.5%. Statistics Canada linked the increase in part to renewed conflict between the United States and Iran, which contributed to higher energy and petroleum prices during the month.
The producer-price increase was not limited to energy. Primary non-ferrous metal product prices rose 4.4% after declining in both June and July. Prices for unwrought gold, silver and platinum-group metals and their alloys rose 8.0%, marking the first monthly increase in that group since January. Silver prices made the largest contribution within the precious-metal group, followed by gold and platinum-group metals.
Chemical and chemical-product prices also turned higher, rising 2.8% from July. Plastic resins increased 10.7%, while fertilizers, pesticides and other chemical products rose 3.0%. Even after removing energy and petroleum products, the overall IPPI still increased 0.8%, showing that August’s factory-gate price gains extended beyond the energy complex.
The annual figures were stronger still. The IPPI was up 13.5% from a year earlier, its 23rd consecutive year-over-year increase. Statistics Canada identified precious metals as the largest contributor to the annual gain, while energy products also remained a major source of pressure. Diesel fuel prices were 75.0% above their August 2025 level, and finished motor gasoline was 42.1% higher.
Raw-material costs rise as crude energy and metals turn higher
Raw-material prices moved up faster than producer prices in August, but the two indexes measure different stages of the production process and should not be read as a direct measure of cost pass-through. The RMPI tracks prices Canadian manufacturers pay for key raw materials, including charges required to bring those commodities to the establishment gate.
Crude energy products rose 7.1% in August after falling in each of the previous three months. Synthetic crude oil prices increased 21.6%, while conventional crude oil prices rose 2.8%. With crude energy excluded, the RMPI still increased 1.1%, so the headline gain was heavily influenced by energy but was not entirely dependent on it.
Metal ores, concentrates and scrap increased 4.0% after two consecutive monthly declines. Gold, silver and platinum-group metal ores and concentrates rose 8.1%, with silver-related material up 9.8% and gold-related material up 6.9%. The change echoed the rise in precious-metal prices visible on the producer side of the data.
Not every major raw-material category moved higher. Prices for animals and animal products fell 3.4%, the largest monthly decline for that group since July 2020, mainly because cattle and calf prices dropped 9.6%. That decrease partly offset the upward pressure from energy and metals.
Annual price pressure remains elevated, but the indexes are not consumer inflation
The 22.8% year-over-year increase in the RMPI was stronger than the 18.2% annual gain recorded in July. Even excluding crude energy products, raw-material prices were 17.2% higher than a year earlier. Precious-metal ores and concentrates were the largest contributor to the annual increase, while conventional crude oil prices were up 29.8% and synthetic crude oil was up 55.3%.
The IPPI and RMPI can provide useful information about price pressure earlier in the production chain, but they are not substitutes for Canada’s Consumer Price Index. The IPPI measures prices received by producers as goods leave the factory gate and excludes indirect taxes as well as transportation, wholesale and retail costs that occur after production. The RMPI measures the prices manufacturers pay for raw materials and includes charges such as transportation, net taxes and customs duties associated with bringing those inputs to the establishment gate.
That distinction matters when interpreting August’s numbers. A higher producer-price index does not mean consumer prices rose by the same amount, and a rise in raw-material prices does not establish how much of that increase manufacturers will ultimately absorb or pass on. The release shows where price pressure strengthened in the production chain, with energy, refined petroleum products and metals accounting for much of the movement.
Statistics Canada plans to begin transitioning the IPPI and RMPI to a new sample with the September 2026 reference month, with the change to be phased in through December. The agency is scheduled to release September’s industrial product and raw-material price indexes on October 22.
More News


Latest News
View all news- Google, Constellation Sign 3.59-GW PJM Power Deal, With $4.3 Billion-Plus Going to Nuclear Uprates
- RPM Posts Record $2.22 Billion Fiscal Q1 Sales, Narrows FY2027 Outlook
- Type One Energy Raises $200 Million Series B to Advance Tennessee Fusion Project
- MIAX Hits Record 17.1% YTD U.S. Options Share as ADV Rises 22%
- Japan’s 10-Year Government Bond Auction Clears Near 3.10% With a 3.1% Coupon