Unemployment Rates Fall in Five U.S. States as National Rate Reaches 4.2%
Maryland and New Hampshire led September’s monthly declines, while only three states recorded statistically significant payroll employment changes.
Our editorial standards
MarketReview publishes clear, independently produced financial information using reliable sources and transparent editorial standards.
Read our Editorial Policy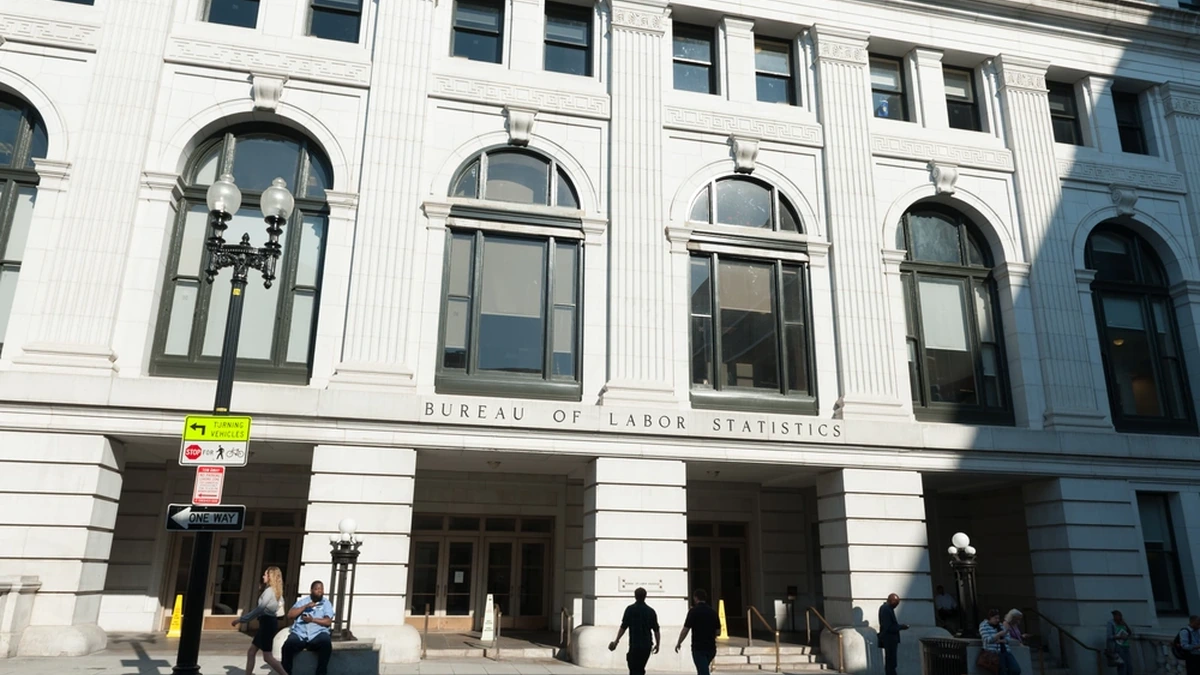
Unemployment rates fell significantly in five U.S. states in September, even as the national jobless rate edged up to 4.2% from 4.1% in August, according to federal figures released Tuesday. Maryland and New Hampshire recorded the largest monthly declines. Across the rest of the country, most state rates showed no statistically meaningful change.
The September results offer a more uneven picture than the national number alone. The five improvements were spread across the Northeast, Mid-Atlantic, Southeast and West, but none was larger than two-tenths of a percentage point. At the same time, payroll employment showed a measurable monthly increase in just two states and a decrease in one.
In its October 20 state employment and unemployment report, the Bureau of Labor Statistics classified the rates in the other 45 states and Washington, D.C., as little changed. That does not mean every reported rate was identical to August. The agency separates movements it considers statistically significant from smaller or less certain changes in its estimates.
Maryland and New Hampshire lead the monthly declines
Maryland’s unemployment rate dropped to 3.9% in September from 4.1% in August. New Hampshire’s rate moved from 2.8% to 2.6%. Both declines were 0.2 percentage point, the largest statistically significant month-to-month changes reported among the states.
Florida, Nevada and Pennsylvania each posted a smaller, 0.1-point decline. Florida’s jobless rate slipped from 4.5% to 4.4%, Nevada’s from 4.8% to 4.7%, and Pennsylvania’s from 3.7% to 3.6%. All five comparisons use seasonally adjusted data, and the September state figures are preliminary.
The size of a rate change is not the only factor behind the agency’s classification. BLS cautioned that some states outside the five had numerical movements at least as large as the changes it identified as significant. A fall in a published percentage therefore should not automatically be treated as evidence of a clear improvement without considering the statistical assessment.
The underlying labor-force figures also require care. In Maryland, for example, the estimated number of unemployed residents fell from 129,839 in August to 124,638 in September, while the state’s civilian labor force remained near 3.2 million. Those modeled estimates help describe the reported rate movement, but the release does not establish that any particular industry or policy produced the decline.
Unemployment still varies widely across states
The lowest unemployment rate in September was South Dakota’s 2.0%, followed by North Dakota at 2.2%. Washington, D.C., had the highest rate in the report at 5.6%. Among the states, California reported 5.1% and Michigan 5.0%, both above the national 4.2% figure. These differences illustrate how much local labor-market conditions vary even when the nationwide measure changes little.
BLS found that 20 states had rates statistically below the U.S. rate, while California, Michigan and the District of Columbia were above it. Rates in the other 28 states were not appreciably different from the national figure. The distinction matters: Florida’s and Nevada’s rates were numerically above 4.2%, for example, but neither was classified as significantly higher than the U.S. rate.
The longer-term comparison is broader than the September monthly changes. Over the year, unemployment rates fell significantly in 20 states and Washington, D.C., rose in seven states and were little changed in the remaining 23. New Jersey recorded the largest annual improvement, a 1.3-point decline from 5.5% in September 2025 to 4.2% this September. Connecticut posted the largest increase, rising 0.9 point to 5.1%.
An improvement within one month does not necessarily describe a state’s full-year direction. Florida’s September rate of 4.4%, for instance, was below its August reading but above the 4.2% recorded a year earlier. BLS did not classify that annual numerical increase as statistically significant. Keeping the two comparison periods separate prevents a short-term decline from being mistaken for a sustained trend.
Payroll employment shows only a few clear monthly moves
The payroll portion of the state report was subdued. New Jersey added 14,900 nonfarm jobs in September, a 0.3% increase, and South Carolina added 12,500, or 0.5%. Wisconsin was the only state with a statistically significant decrease, losing 13,700 payroll jobs, or 0.4%. Employment in the other 47 states and Washington, D.C., was essentially unchanged under the agency’s assessment.
None of the five states with a significant fall in unemployment was among the two states with a significant rise in payroll jobs. That is not necessarily a contradiction. Unemployment rates measure people in the civilian labor force based on where they live, while payroll data count jobs at employers based on where the jobs are located. The two programs have different coverage and estimation methods, and their monthly results need not move together.
A longer look at payrolls also reveals substantial regional differences. From September 2025, payroll employment increased significantly in seven states. Texas added 154,300 jobs, California gained 129,300 and North Carolina added 67,000, the largest increases by number of positions. Washington, D.C., recorded the only statistically significant annual decline, down 25,800 jobs, or 3.5%. Employment in the other 43 states was classified as little changed from a year earlier.
Nationally, the earlier October 2 employment report put September payroll growth at 29,000 and the number of unemployed Americans at about 7.1 million. BLS described both national payroll employment and the 4.2% jobless rate as little changed. The national rate had risen one-tenth of a point from August, so describing it as unchanged at precisely 4.2% would be misleading, even though the agency considered the movement modest.
State unemployment figures are produced largely from model-based estimates incorporating household-survey and other data, while state payroll estimates draw on employer records. Revisions can alter the preliminary picture, and a statistically stable reading is not proof that hiring, joblessness or labor-force participation remained perfectly still. The September release is best read as evidence of a small group of clear state-level rate improvements, not a nationwide decline in unemployment.
The next geographic detail is due October 28, when BLS is scheduled to publish September metropolitan-area employment and unemployment data. The agency has scheduled its October state employment report for November 20, providing the next comparable monthly check on whether the five states’ declines continue.
More News



Latest News
View all news- U.S. Crude Inventories Fall 3.1 Million Barrels in Latest EIA Report
- Thermo Fisher Scientific Reports 9% Revenue Growth to $12.14 Billion
- OCC Issues Final Rule to Implement GENIUS Act Stablecoin Regulations
- Ohio Auto Parts Manufacturer Agrees to Pay $3 Million Over PPP Loan Allegations
- CFTC Announces $9.2 Million Penalty in Louisiana Forex Fraud Case