
U.S. Housing Starts Fall 5.2% in September to 1.22 Million Annual Rate
Single-family construction fell 4.6%, while building permits barely changed and wide statistical margins complicated the monthly picture.
Our editorial standards
MarketReview publishes clear, independently produced financial information using reliable sources and transparent editorial standards.
Read our Editorial Policy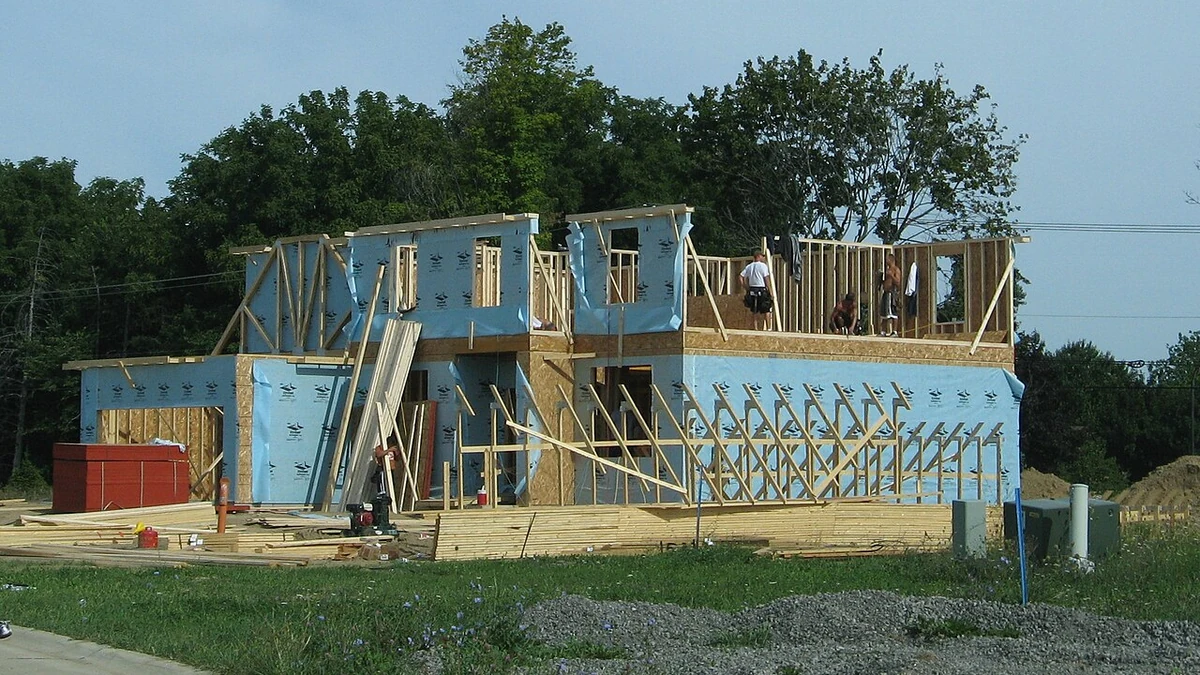
U.S. housing starts fell 5.2% in September to a seasonally adjusted annual rate of 1.221 million units, extending a decline in the pace of residential construction. The Census Bureau and the Department of Housing and Urban Development reported the figure Tuesday, October 20, compared with a revised August rate of 1.288 million. Starts were also 7.4% below their September 2025 pace of 1.319 million.
Construction of single-family homes slowed alongside projects in larger multifamily buildings. Single-family starts decreased 4.6% from August to an annualized 859,000 units, while starts in buildings containing at least five homes fell 7.2% to 349,000. The two categories moved in the same direction for the month, but their year-over-year performances tell a different story.
The monthly decline needs an important qualification. Census attached a margin of error of 11.8 percentage points to the 5.2% drop, meaning the change was not statistically significant at the 90% confidence level. Its reported 7.4% annual decline likewise came with an 11.5-point margin of error. The estimates indicate a slower September pace, but the statistical ranges do not establish that the underlying market definitively contracted by those amounts.
Housing starts measure when construction begins, generally when excavation for the foundation gets underway. They are not a measure of homes sold or completed. The government’s September new residential construction report presents starts alongside permit authorizations and completions, providing a view of projects at different stages rather than one interchangeable measure of homebuilding activity.
Large Multifamily Projects Account for Much of the Annual Weakness
The sharpest contrast lies between single-family construction and larger multifamily developments. September’s single-family start rate was 2.6% above the 837,000 pace recorded a year earlier, despite falling from August. In buildings with five units or more, starts were down 25.9% from a year earlier, when the annualized rate stood at 471,000. That drop of roughly 122,000 units in the larger-building category more than offset the annual gain in single-family starts.
Monthly multifamily figures can swing substantially as relatively few large projects move into construction. Census recorded a rate of 519,000 starts for buildings with five or more units in June, 484,000 in July and 376,000 in August before September’s 349,000 reading. This pattern points to weaker recent activity in the category, although individual months can be affected by the timing of large developments.
The broader year-to-date comparison is less severe than the September headline. On a not-seasonally-adjusted basis, an estimated 1.0365 million housing units were started in the first nine months of 2026, compared with 1.048 million in the corresponding period of 2025, a decline of 1.1%. That cumulative figure covers units actually begun during the period, unlike the annualized monthly pace used in the headline.
Single-family starts account for the majority of residential construction, and their direction remains especially relevant to buyers seeking newly built houses. The rise from September 2025, however, should not be mistaken for sustained growth: the September rate was below both August’s 900,000 and March’s 1.017 million. A single year’s comparison cannot resolve the more recent loss of momentum.
Permits Hold Nearly Steady as the Construction Pipeline Changes
Building permits offered a less pronounced decline. Authorizations for privately owned housing units slipped 0.2% in September to an annualized 1.400 million, down from a revised 1.403 million in August. The permit rate was 3.0% lower than the 1.444 million recorded a year earlier. These approvals indicate projects permitted to proceed, not work that has necessarily begun.
The split by building type was again important. Single-family permits dropped 4.0% to 845,000 from 880,000 in August. Authorizations in buildings with five or more units, by contrast, rose to 503,000 from 475,000, an increase of 5.9% in the detailed Census tables. That improvement does not guarantee a similar rise in future starts: approved projects can be delayed, changed or never built.
At the end of September, the number of units authorized but not yet started was estimated at 279,000 on a seasonally adjusted basis, compared with 278,000 at the end of August. About 151,000 of September’s total were single-family units. The near-steady backlog suggests that permit approvals and actual construction starts were moving at different speeds, rather than every new authorization immediately reaching a job site.
Homes already in the building process provided another counterpoint. Housing completions rose 2.2% from August to a seasonally adjusted annual rate of 1.192 million units. Still, that rate was 14.0% below September 2025’s 1.386 million. Single-family completions fell 2.4% for the month to 840,000, while completions in buildings with five or more units ran at 339,000.
Census also counted 1.280 million housing units under construction at the end of September on a seasonally adjusted basis, unchanged from August and 3.3% below a year earlier. This measure concerns the stock of unfinished units at a point in time, not the annualized pace of new starts. Taken together, starts, permits, construction in progress and completions describe different stages of the supply pipeline, with changes unlikely to appear in all four measures simultaneously.
Regional Swings and Mortgage Costs Complicate the Outlook
The national decline masked notably different regional results. Starts in the South rose 6.1% from August to an annualized 714,000 units, while the Northeast held at 114,000. The Midwest’s rate fell 19.0% to 158,000, and the West registered a 23.2% decline to 235,000. These regional figures are preliminary survey estimates, not precise counts of construction activity.
The West’s monthly decline narrowly exceeded its 22.9-percentage-point margin of error at the 90% confidence level. Margins for the other regions were wide enough to include no change, reinforcing the need to distinguish reported estimates from firm conclusions about local conditions. Regional differences also mean that the nationwide 5.2% decline does not describe the experience of every housing market.
Borrowing costs remain part of the backdrop. Freddie Mac’s weekly survey put the average 30-year fixed mortgage rate at 7.40% as of October 15, unchanged from the prior week but above the 6.27% average a year earlier. That reading was measured after the September construction period and cannot establish why starts moved during the month. Higher mortgage payments nonetheless affect what prospective buyers can afford, an important consideration when builders assess demand for new homes.
A separate builder survey points to continued caution. The National Association of Home Builders reported on October 19 that its confidence index for newly built single-family homes fell three points to 29 in October. The association said 43% of surveyed builders reduced prices, while 65% used sales incentives. Those figures measure builders’ assessments and selling practices, rather than the number of houses that broke ground in September, but they give additional context for the construction slowdown.
The next Census release, scheduled for November 18, will cover October housing starts, permits and completions. It will also provide revised estimates for September, offering a further check on whether the recent weakness in construction starts persists beyond a single month’s preliminary figures.
More News


Latest News
View all news- Five Tradr Leveraged ETFs Reach October 20 Trading Suspension Date on Cboe
- SEC and French Regulator Sign Oversight Agreement for Cross-Border Investment Advisers
- NCUA Proposes Easing Three Credit Union Rules, Including Investment Reserve Requirements
- GM Authorizes $20 Billion Share Buyback After Reporting $3.3 Billion Quarterly Profit
- GE Aerospace Raises 2026 Outlook as Third-Quarter Orders Jump 49%
