

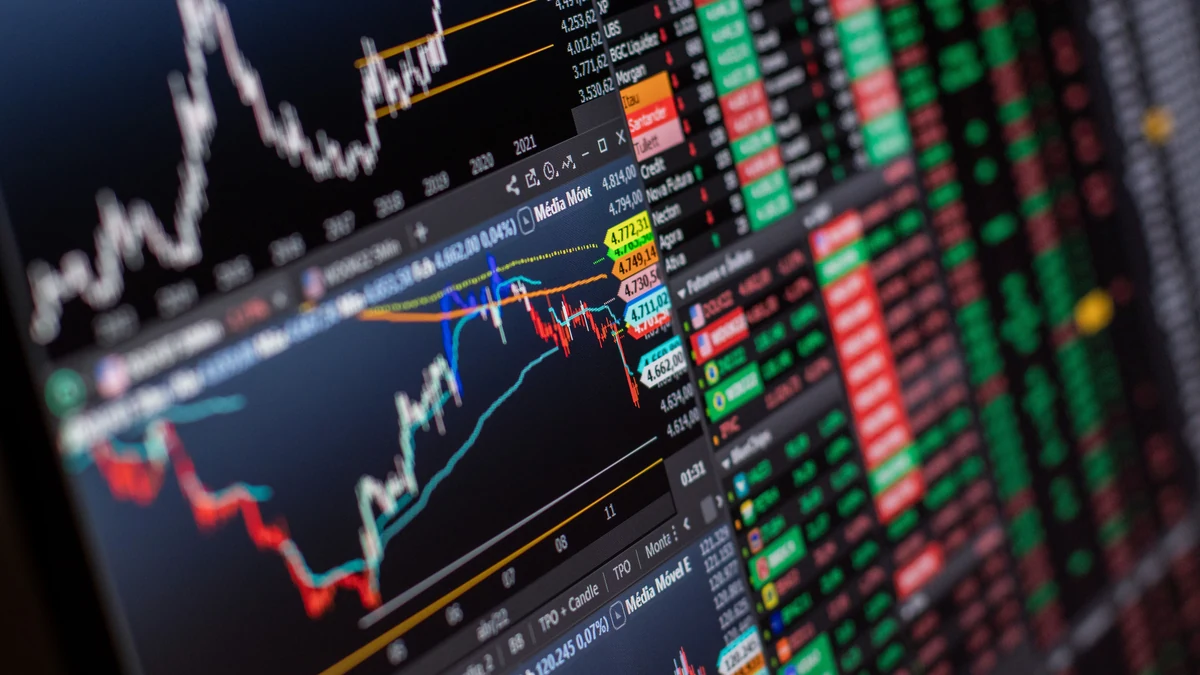
Technical data is the market’s own record of what has traded, at what price, and with how much activity. For a trader, that record may be the main raw material for deciding when to enter or exit. For a long-term investor, it can serve a different purpose: showing whether the market is confirming, questioning, or sharply rejecting an investment thesis.
The useful question is not whether a chart can reveal the future with certainty. It cannot. The better question is whether past and current market behavior contains information that can improve a decision when it is interpreted with an appropriate timeframe and realistic expectations. Technical analysis becomes more useful when it is treated as a disciplined way to measure price behavior, rather than as a collection of patterns that supposedly guarantee what happens next.
What technical data actually measures
Technical analysis begins with observable market data rather than estimates of a company’s future profits or intrinsic value. Price is the most obvious input, but analysts also work with trading volume, returns, volatility, relative performance and, in derivatives markets, open interest. Different tools transform those inputs in different ways, yet they all remain descriptions of market behavior rather than direct measurements of business quality.
That distinction is important because technical data is exact in one sense and incomplete in another. A closing price is an actual market observation, and yesterday’s trading volume is a recorded quantity. Neither tells an investor what a business is worth five years from now, whether management will allocate capital well, or whether a new competitor will damage future earnings. Technical data tells you what market participants have done with the information, expectations and constraints they had at the time.
Price and returns
Most charts are built from some combination of the open, high, low and closing prices for a chosen interval. A daily candlestick can show all four, while a simple line chart may display only closing prices. The choice changes how much short-term variation is visible, but it does not change the underlying fact that each chart is a compressed history of transactions.
Returns put those price changes on a comparable basis. A move from $20 to $22 is a 10 percent gain, while the same $2 increase from $100 to $102 is only 2 percent. Analysts often compare percentage changes rather than raw price changes for this reason, particularly when looking across securities with very different prices or across long periods in which a stock has split.
For investors, adjusted price histories matter when dividends, stock splits and other corporate actions would otherwise distort the record. A chart that ignores a split can show an apparent collapse that never represented an economic loss, while a price-only chart can understate the total return from an investment that distributed meaningful dividends. Technical work is only as good as the data series being analyzed.
Volume and open interest
Volume measures how much of a security changed hands during a period. It is often used to judge the amount of participation behind a move, but high volume is not automatically bullish and low volume is not automatically bearish. Every completed trade has both a buyer and a seller, so volume shows activity rather than which side was objectively “right.”
Context gives volume meaning. A price breakout accompanied by unusually heavy trading may indicate that many participants are willing to transact at the new level, while a sharp move in a thinly traded security may be easier to reverse. The interpretation still depends on the asset, its normal liquidity and the timeframe being studied.
Open interest is mainly relevant to futures and options. It counts outstanding contracts that have not yet been closed or settled, which makes it different from daily volume. Changes in open interest can help describe participation in a derivatives market, but they do not provide a standalone direction signal and need to be read alongside price and the structure of the market.
Momentum, relative strength and volatility
Momentum describes the persistence or rate of price movement. Relative strength compares an asset’s performance with another asset, an index or a peer group. Volatility measures the magnitude of price variation rather than direction. These concepts are related because they all come from market behavior, but an asset can have strong positive momentum and high volatility at the same time, or low volatility while steadily underperforming a benchmark.
Separating these ideas prevents a common analytical mistake. A rising price is not automatically evidence of low risk, and a volatile asset is not necessarily in a weak trend. Technical analysis becomes more informative when each measure has a defined job instead of several indicators being treated as interchangeable votes for the same conclusion.
From market history to inference
Technical analysis becomes controversial when observation turns into inference. Everyone can agree on the historical price. The disagreement begins when an analyst argues that the shape, speed or persistence of that history changes the probability of what comes next.
There is evidence that some historical price patterns contain information, but the evidence does not justify treating chart signals as deterministic. A well-known study by Andrew Lo, Harry Mamaysky and Jiang Wang developed objective algorithms for several traditional chart patterns and found that some provided incremental information about subsequent returns over their sample. The authors were careful not to equate that result with guaranteed excess trading profits, which is an important distinction for anyone using technical analysis in practice.[1]
Markets can display persistence for several reasons. Investors receive and process information at different speeds, large institutions cannot always change positions instantly, and price moves themselves can attract or discourage additional participation. Behavioral responses can reinforce an existing move for a time, while changing expectations can later reverse it. None of these mechanisms requires the next price to be knowable in advance.
The practical consequence is that a technical signal should be thought of as conditional evidence. A trend, breakout or momentum reading may alter the balance of probabilities, but it does not remove the possibility of reversal. Good technical work therefore includes an explicit plan for being wrong, because a signal that never anticipates error is not a risk-management process.
Timeframe changes the signal
The same security can look bullish on a weekly chart, weak on a daily chart and sharply oversold on an hourly chart. Those observations are not contradictory because each chart is answering a different question. The relevant timeframe depends on how long the position is expected to be held and how frequently the investor is prepared to act.
Short-term trading places more weight on immediate price behavior because the holding period is short. A trader may care about an intraday break of support because the planned position is measured in hours. An investor who expects to own a diversified equity position for many years can watch the same move without needing to respond to it.
The longer-term focus of investments does not make technical information irrelevant, but it changes which information deserves attention. A monthly trend, a prolonged period of relative weakness or a major change in volatility may matter to a long-term investor even when daily fluctuations do not. Matching the speed of the signal to the intended holding period helps reduce the temptation to turn a long-term portfolio into a sequence of short-term reactions.
Timeframe also changes the economics of a strategy. Faster signals create more opportunities to trade, but they also create more transactions, more exposure to bid-ask spreads and more chances to react to temporary noise. Slower signals reduce turnover but respond later when a real change in market direction occurs. No setting eliminates that trade-off.
Claims that technical analysis has exactly the same validity on every timescale should therefore be treated cautiously. Market microstructure, liquidity, transaction costs and the type of participants involved differ between a one-minute chart and a monthly chart. The analytical concepts may transfer across horizons, but the behavior of the data and the practical consequences of acting on it do not remain identical.
Indicators are transformations, not new facts
Technical indicators can make market behavior easier to see by transforming raw data into a smoother or more standardized form. A moving average reduces some day-to-day variation, an oscillator measures the location or speed of recent movement, and a relative-strength calculation compares performance across assets. The indicator is useful only if the transformation clarifies something relevant to the decision.
It is easy to mistake a screen full of indicators for independent confirmation. Many commonly used tools are calculated from the same underlying prices, so three bullish readings can amount to three different versions of the same recent advance. Adding indicators does not necessarily add information, and it can make a weak process look more rigorous than it is.
Moving averages and trend measures
A moving average is one of the simplest ways to smooth a price series. If price remains above a long-term average and the average itself is rising, an analyst may describe the market as being in an established uptrend. Crossovers between shorter and longer averages are also used as signals, although every moving-average method is backward-looking because the calculation depends on prices that have already occurred.
That lag is not a flaw that can be engineered away completely. A faster average reacts sooner but produces more changes in direction, while a slower average filters more noise and responds later. Investors should choose the compromise that fits the purpose of the analysis rather than searching for a parameter that happens to look perfect on one historical chart.
Oscillators and momentum tools
Momentum tools attempt to measure the speed or persistence of price movement. Some oscillators also compare recent gains with recent losses or locate the current price within a recent range. Terms such as “overbought” and “oversold” are often attached to extreme readings, but those labels can be misleading if they are interpreted as automatic reversal signals. A strong trend can remain stretched by an oscillator’s standards for an extended period.
FINRA notes that momentum investors commonly use technical indicators based on price, volume or open interest to judge whether momentum may continue. It also warns that indicators can produce false signals in volatile markets and that unexpected economic, industry or geopolitical developments can change price direction rapidly.[2] The warning applies beyond momentum strategies because any rule derived from historical market data faces the possibility that the conditions producing the signal will change.
Support, resistance and patterns
Support and resistance refer to areas where buying or selling has previously been strong enough to interrupt a move. They are better understood as zones of prior market interest than as invisible barriers. Prices can react near an old level because participants remember it, because orders cluster there, or because the level coincides with a valuation or risk threshold that matters to many investors.
Chart patterns try to organize sequences of highs, lows and consolidations into recognizable structures. The danger is subjectivity. Two analysts can look at the same history and draw different boundaries, particularly when the pattern is identified after the outcome is already known. Rules become more testable when the conditions for recognizing a pattern are specified before the trade rather than adjusted to fit what happened afterward.
Technical data for investors, not just traders
Technical analysis is most closely associated with active trading, but investors can use market data without adopting a short-term trading style. Someone investing in stocks may use long-term price and relative-strength information to monitor whether a holding is behaving materially differently from its industry or the broad market. A persistent divergence can justify a deeper review even when it does not trigger an automatic sale.
The same principle applies to broad investing decisions. Market data can reveal rising concentration in a portfolio, a sustained increase in volatility, or a prolonged drawdown that has changed the investor’s actual risk exposure. Technical information is most useful when it prompts a defined portfolio action, such as reviewing a position, rebalancing or reassessing an assumption, rather than encouraging constant discretionary trading.
Entry timing is another possible use. A fundamentally attractive security can continue falling after it first appears cheap, so an investor may choose to wait for evidence that selling pressure has stabilized before building a position. That approach sacrifices the possibility of buying at the exact bottom in exchange for additional evidence about market behavior. It should not be confused with proof that the decline has ended.
Exit decisions can also benefit from explicit market rules. Investors sometimes tolerate a deteriorating position because the original thesis still sounds plausible, then continue holding after the evidence has materially changed. A predefined review trigger based on price, relative performance or volatility can force a fresh assessment without requiring the technical signal itself to make the final decision.
For a diversified long-term portfolio, technical analysis is usually more useful as a risk and monitoring tool than as a reason to move the entire portfolio in and out of the market. Large allocation changes create re-entry decisions as well as exit decisions, and an investor who sells during a decline must later decide when to buy again. A process that defines only the exit is incomplete.
Technical analysis and fundamental analysis answer different questions
Technical analysis is not generally superior simply because price data is “complete” while fundamental analysis is incomplete. Price data is completely relevant to the history of price, but that does not make it a complete description of an investment. A chart does not directly tell an investor about cash flows, leverage, competitive position, management incentives, asset quality or the durability of a company’s economics.
Fundamental analysis has its own limitations. Forecasts can be wrong, valuation is sensitive to assumptions, and a strong business can still be a poor investment if the purchase price is too high or if market expectations are already more optimistic than the analyst’s estimate. Technical analysis avoids some forecasting assumptions by concentrating on observed market behavior, but it introduces different problems involving signal choice, timing and interpretation.
The two approaches can therefore complement one another. Fundamentals can help answer what an investor is buying, what could drive long-term value and what risks are embedded in the business. Technical evidence can help answer how the market is currently treating that asset, whether the trend is strengthening or weakening, and whether recent behavior is consistent with the investor’s expectations.
Combining the approaches does not require giving them equal weight. A long-horizon investor may make security selection and valuation primarily from fundamentals, then use technical data for position timing and monitoring. A trader may do almost the reverse, using price and volume for most decisions while checking fundamentals mainly to understand event risk or avoid trading through information that could create an abrupt repricing.
Where technical analysis goes wrong
Hindsight is one of the biggest hazards. After a rally or collapse has happened, support lines, breakouts and reversal patterns often look obvious. The relevant question is whether the rule identified the signal in real time, before the outcome was known, and whether the same rule would have behaved acceptably across many other periods.
Overfitting creates a related problem. If an analyst tests enough moving-average lengths, oscillator settings and pattern definitions, some combination will look impressive by chance. The more freedom the analyst has to adjust a rule after seeing the historical result, the less confidence an investor should place in the backtest. A credible test separates the rule-building period from data used to evaluate whether the rule still works.
Trading costs can erase small statistical advantages. Commissions are often low, but bid-ask spreads, slippage, taxes and the market impact of frequent trading still matter. A strategy that looks attractive before costs may become ordinary after implementation, particularly when it trades frequently or operates in less liquid securities.
False breakouts and whipsaws are unavoidable in many trend-based systems. Price moves through a level, the signal triggers, and the market quickly reverses. Investors sometimes respond by adding more filters until the historical record looks cleaner, but each filter also delays genuine signals and can simply move the problem rather than solve it.
Market regimes change as well. A rule that prospered during a persistent trend may struggle in a sideways market, while a mean-reversion rule can be badly hurt when a strong directional move keeps extending. Technical methods need to be judged across different environments rather than only during the period that best suits their design.
The SEC’s investor education material warns that momentum investing can lead to significant losses when an expected trend fails and describes “noise trading” as buying or selling without fundamental data, often with poor timing and overreaction to news. It also urges investors to keep their time horizon and long-term objectives in view when considering short-term activity.[3] Technical analysis does not have to become noise trading, but it can if signals are followed without a coherent investment objective or risk process.
Leverage makes every weakness more consequential. Margin, options and short positions can magnify the effect of an incorrect signal, and short selling has an asymmetric loss profile because the price of a security can rise far beyond the entry price. Technical confidence is not a substitute for understanding the instrument used to express the view.
Building a practical technical process
A useful technical process starts with the decision that needs to be made, not with the indicator. An investor might want to know whether a long-term holding is still participating in a broad market advance, whether a recent decline has changed the risk profile, or whether a planned purchase is showing signs of stabilization. Defining the question first makes it easier to choose data that is relevant rather than merely interesting.
The timeframe should then match the expected holding period. A long-term investor can use weekly or monthly information for major decisions while still looking at daily data when executing a trade. The key is to avoid allowing a faster chart to overrule a slower investment thesis simply because short-term movements are more visually dramatic.
Signals should be explicit enough to be evaluated. “The chart looks weak” is difficult to test or repeat, while a rule based on a defined trend, relative-performance threshold or volatility change can be reviewed consistently. The rule should also specify what action follows, because a signal that generates anxiety but no defined decision adds little value.
Risk management belongs in the process before a position is opened. Position size, maximum acceptable loss, diversification and liquidity are at least as important as the entry. An investor also needs to know what happens after an exit, including the conditions for re-entry, because avoiding a decline is not useful if the portfolio then misses a recovery indefinitely.
Historical testing is valuable when it is used to challenge a rule rather than decorate it. Tests should include realistic costs and periods that were not used to design the strategy. A rule that only works with one market, one narrow setting or one favorable period deserves more skepticism than a simpler method that behaves reasonably across different conditions.
Technical data is strongest when it disciplines observation. It can show that a trend has weakened, that volatility has changed or that an asset is persistently lagging its benchmark without requiring a story about why. What it cannot do is eliminate uncertainty, establish intrinsic value or guarantee that a familiar pattern will repeat.
For most investors, that is enough to make technical analysis useful without making it dominant. Market behavior belongs in the investment process because price is where gains and losses are ultimately realized, but the quality of the decision still depends on timeframe, risk, valuation, diversification and the investor’s reason for owning the asset. Technical data should sharpen those decisions, not replace them.
FAQs
- Can technical analysis predict stock prices?
Technical analysis can identify trends, momentum and other recurring features of market behavior, but it cannot predict future prices with certainty. A useful signal changes the evidence available to the investor rather than eliminating the risk of reversal or false signals.
- Is technical analysis better than fundamental analysis?
Neither approach is inherently superior for every decision. Fundamental analysis focuses on business economics, financial condition and valuation, while technical analysis focuses on market behavior such as price, volume and momentum. Investors can use one approach primarily or combine them depending on the decision being made.
- Can long-term investors use technical analysis?
Yes, but the timeframe should match the investment horizon. Long-term investors are more likely to use slower trend, relative-performance or volatility measures for monitoring and risk review rather than reacting to every short-term price move.
- What technical data matters most?
Price is the foundation of most technical analysis, with volume, returns, volatility, relative strength and open interest adding context where appropriate. The most useful data is the data that answers a defined investment question rather than simply adding more indicators to a chart.
Sources
- National Bureau of Economic Research: Foundations of Technical Analysis: Computational Algorithms, Statistical Inference, and Empirical Implementation
- FINRA: What Is Momentum Investing?
- U.S. Securities and Exchange Commission: Investor Alert: Thinking About Investing in the Latest Hot Stock? Understand the Significant Risks of Short-Term Trading Based on Social Media