
Australia’s Economy Grew 2.3% in 2025–26 as Household Saving Rate Rose
GDP per capita rose 0.8% and the household saving ratio reached 6.1%, as revised national accounts showed a stronger year for the Australian economy.
Our editorial standards
MarketReview publishes clear, independently produced financial information using reliable sources and transparent editorial standards.
Read our Editorial Policy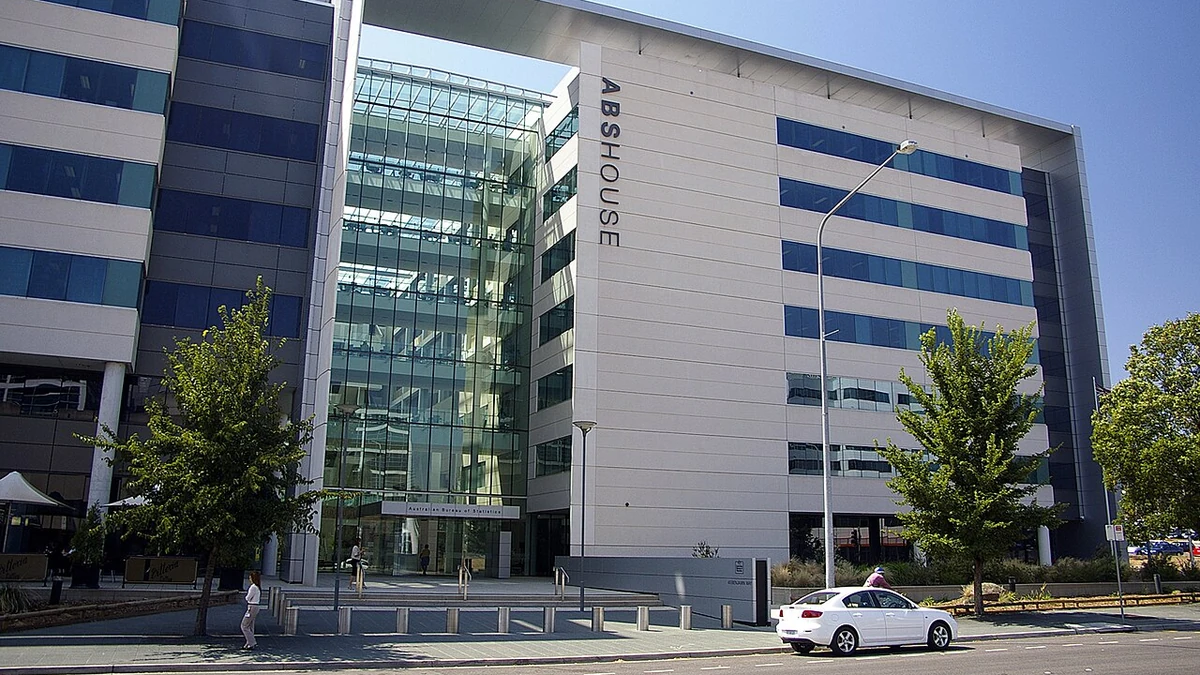
Australia’s economy grew 2.3% in the 2025–26 financial year, accelerating from 1.6% in 2024–25, while households saved a larger share of their income. The Australian Bureau of Statistics (ABS) reported Friday that the household saving ratio rose to 6.1% from 5.5% a year earlier.
On a per-person basis, the improvement was more modest. GDP per capita increased 0.8% after no growth in the preceding financial year, illustrating the difference between a bigger economy and the amount of economic activity attributable to each resident. Labour productivity also returned to positive growth, though the annual increase was small.
The ABS annual national accounts, released October 23, measure GDP growth in chain-volume terms, which adjust for changes in prices. On a current-price basis, GDP rose 5.4%. The agency revised its 2025–26 real growth estimate down by 0.1 percentage point from the figure calculated when the June-quarter accounts were published.
Household saving rose even as spending continued
Household saving has rebounded from a ratio of 2.7% in 2023–24. It increased to 5.5% in 2024–25 before reaching 6.1% in the latest financial year. These figures describe the share of household disposable income not used for consumption, rather than the interest rate earned on savings accounts or a direct measure of cash deposits.
Higher saving does not necessarily mean Australians bought fewer goods and services. A household can increase spending and still save a larger proportion of its income if its income grows faster. The annual national accounts establish that the aggregate saving share increased; they do not show that every family became more financially secure or identify one cause for the change.
Earlier quarterly figures provide some context for the year’s end. In its September release covering the June 2026 quarter, the ABS reported a 0.4% rise in real household consumption and a 1.8% increase from the same quarter a year earlier. The seasonally adjusted quarterly household saving ratio edged up to 6.5% from 6.4% in March, alongside a 1.5% rise in compensation of employees.
Those June-quarter readings should not be confused with the newly reported 6.1% annual ratio. They cover a single three-month period, and the annual publication incorporates updated data and revisions. The earlier report described household spending as subdued across many categories, supporting a picture of cautious consumption without establishing that rising saving alone held back growth.
Growth per person and productivity improved
Australia’s 2.3% full-year GDP increase followed 1.6% growth in 2024–25 and 1.3% in 2023–24. GDP per capita followed a different path: it fell 1.1% in 2023–24, was unchanged in 2024–25 and rose 0.8% in 2025–26. The latest gain therefore marks an improvement in output per resident, but it is substantially smaller than the headline GDP increase.
Aggregate GDP can rise as the population grows, even if output per person moves little. GDP per capita is not a complete measure of household living standards, however. It does not show how income is distributed, how living costs have changed for different households, or whether the benefits of growth have reached workers evenly.
Output growth was stronger across the ABS market-sector grouping than in its non-market grouping. Market-sector gross value added increased 2.5%, compared with 1.3% the year before. Non-market gross value added grew 2.0%, slowing from 3.3%. These measures classify economic activity by industry and should not be read as an exact split between privately and publicly funded spending.
Productivity figures offered another qualified improvement. GDP per hour worked rose 0.5% after falling 0.5% in 2024–25. Within the market sector, gross value added per hour worked increased 0.9% following a 0.2% decline. Productivity in the non-market sector remained negative, at minus 0.2%, though that was slightly better than the previous year’s minus 0.3%.
Real net national disposable income grew 2.2%, up from 0.9% in the preceding year, according to the annual accounts. That measure considers the country’s income after adjusting for prices and other national-account factors, and is not interchangeable with household disposable income. Australia’s terms of trade fell just 0.2% in 2025–26, compared with a 3.9% decline in 2024–25.
Revisions changed both years in the comparison
Both years in that growth comparison have been revised. The ABS lowered the 2025–26 estimate from the previously published annualised 2.4% to 2.3%. Separately, the agency’s historical-revisions material shows that 2024–25 growth was raised from 1.4% to 1.6%. On the current figures, annual GDP growth strengthened by 0.7 percentage point.
Annual supply-use benchmarks for 2024–25 underpin the latest accounts. These tables reconcile three ways of measuring GDP: what Australia produces, what is spent on that production and the income it generates. They draw on more complete business, household, tax and trade information than was available when the first quarterly estimates were produced.
Figures for 2025–26 remain subject to the normal national-accounts revision process. Full supply-use tables have not yet been constructed for that financial year, so the latest annual estimates still contain a statistical discrepancy. The ABS also updated earlier series using improved measurements of health care and social assistance, non-life insurance trade and international passenger transport services.
Not every change to a historical series reflects a fresh shift in the economy. A revision can result from better source data, reclassification or improved measurement. The distinction matters when comparing a newly released annual growth rate with numbers reported months earlier: figures compiled on different information sets may not describe precisely the same statistical baseline.
Australia’s national balance sheet grew as well. The ABS estimated national net worth at $22.8 trillion, up $1.3 trillion from $21.5 trillion a year earlier. That is a measure of the nation’s stock of assets less liabilities, not an amount of money available for households to spend or save. National net saving rose to $102.0 billion from $99.0 billion.
More geographic detail is scheduled next. The ABS plans to publish its 2025–26 state accounts on November 18, including state and territory gross state product estimates. Those figures will show how the national expansion was distributed across Australia before the next quarterly national accounts incorporate the updated annual benchmarks.
More News


Latest News
View all news- University of Michigan Research Warns Long-Term Inflation Expectations Could Become Entrenched
- First Citizens Authorizes $1.2 Billion Share Buyback Alongside Third-Quarter Earnings
- American Express Raises 2026 Profit Outlook After Record $20.1 Billion Quarterly Revenue
- U.K. Retail Sales Fall 0.4% in September Despite Third-Quarter Growth
- Japan’s September Consumer Inflation Reaches 2.1%, With Underlying Prices Up 2.4%
