
U.S. Economic Growth Accelerates to 3.4% in Third Quarter
Stronger investment and continued consumer spending lifted output, while weaker exports and higher imports held back some of the gain.
Our editorial standards
MarketReview publishes clear, independently produced financial information using reliable sources and transparent editorial standards.
Read our Editorial Policy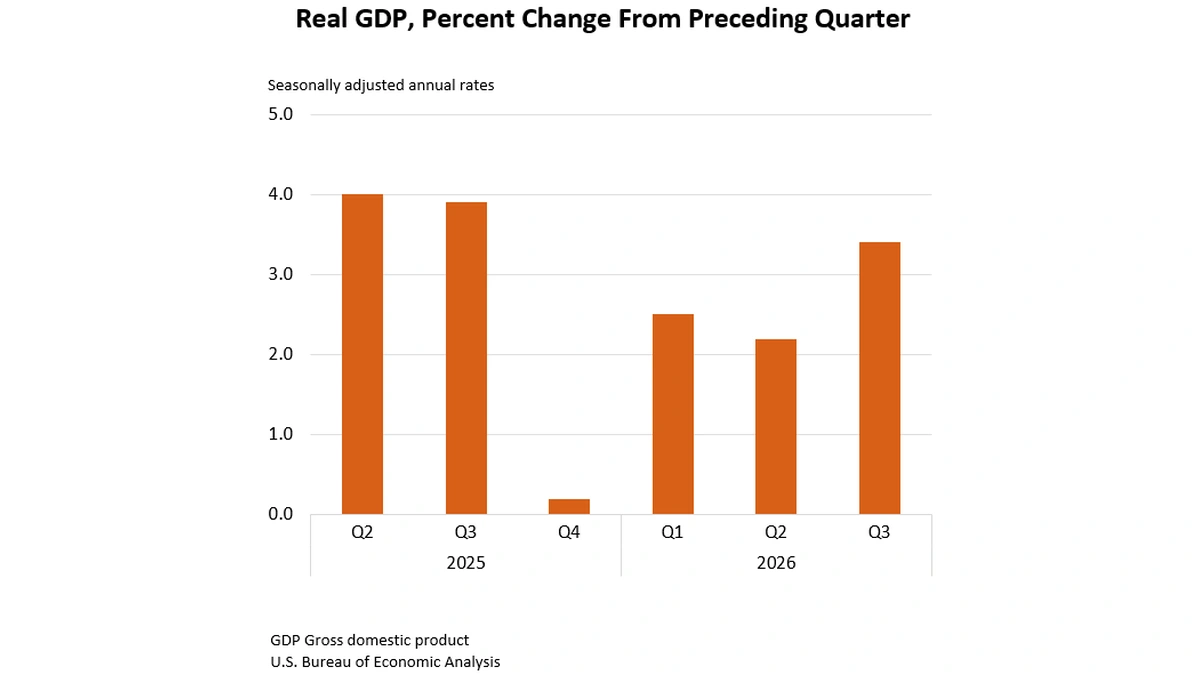
The U.S. economy expanded at a 3.4% annualized rate in the third quarter of 2026, accelerating from 2.2% in the previous quarter, according to an advance estimate released Thursday by the Bureau of Economic Analysis. Investment and consumer spending helped lift economic output between July and September, with government spending also increasing. A decline in exports and a larger increase in imports partly offset those gains.
The acceleration marked a pickup in inflation-adjusted production rather than a 3.4% increase over just three months. BEA put the actual quarter-to-quarter rise in real GDP at about 0.8%. The annualized headline rate shows how quickly the economy would grow over a full year if that quarter’s pace continued, not a forecast that it will do so.
In its October 29 GDP release, BEA identified faster investment and a rebound in government spending as the main reasons growth improved from the second quarter. Trade moved in the opposite direction: exports turned lower, and imports rose more than they had in the previous quarter. The mix matters because the headline growth rate does not show which sources of demand are likely to persist.
Business investment and household spending lift output
Much of the improvement in business investment came from inventories and equipment. Companies added to inventories in the third quarter, with wholesale trade and manufacturing accounting for the largest increases. Both categories were led by nondurable goods industries, according to BEA’s technical notes. Inventory accumulation adds to GDP when businesses produce goods that have not yet been sold, but it can fluctuate as firms adjust supply to future orders.
Equipment investment also strengthened. Computers and peripheral equipment led the increase within information-processing equipment, a detail that places purchases of technology hardware among the quarter’s notable sources of investment growth. BEA based much of that estimate on Census Bureau trade and advance economic data. The release does not, by itself, establish how much of the spending was connected to artificial intelligence or any particular corporate investment program.
Household spending increased across services and goods. Health care, including hospital and outpatient services, was a leading source of services growth, alongside food services and accommodations. Within goods, BEA singled out other nondurable products, particularly prescription drugs. These categories point to contributions from ordinary household purchases as well as business investment, rather than an expansion dependent on a single sector.
Government spending also rose, though its details require care. BEA said federal expenditures, especially nondefense consumption, more than accounted for the increase. The pattern was influenced by smaller sales of crude oil from the Strategic Petroleum Reserve than in the second quarter. In the national accounts, those sales reduce recorded government consumption; fewer sales therefore raise that measure. BEA specifically noted that the oil’s treatment elsewhere in GDP means this change has no direct effect on overall output.
Those distinctions are important when interpreting what drove the stronger quarter. A rise in inventories does not necessarily mean retailers sold more products, and the government spending figure is not simply a measure of new programs or purchases. The broader report nevertheless shows higher consumer expenditures and more business equipment investment alongside the inventory increase.
Private domestic demand remains firm despite weaker trade
A separate measure in the release suggests that the expansion extended beyond inventory accumulation. Real final sales to private domestic purchasers rose at a 4.9% annualized rate in the third quarter, compared with 4.6% in the second. That measure adds consumer spending to private fixed investment while excluding inventories, government expenditures and net exports. It can help distinguish underlying private demand from changes in stockpiles and trade.
The increase in final sales does not eliminate questions about the durability of growth. It measures spending and investment across the economy, not whether every household or business is benefiting equally. Still, the move from 4.6% to 4.9% shows that private domestic purchases continued to expand rapidly even as the overall GDP estimate was affected by changes in inventories and international trade.
Exports declined in the third quarter after contributing more favorably to the previous quarter’s performance. BEA attributed the drop mainly to goods exports, led by petroleum and related products. Imports increased, with capital goods other than automobiles making the largest contribution. Because imports represent goods and services produced abroad, they are subtracted when GDP is calculated to isolate the value created within the United States.
That accounting treatment can be counterintuitive. An imported computer or machine may be included in a U.S. company’s investment spending, but its foreign-produced value must also be removed through the imports calculation. Higher imports can therefore accompany strong domestic purchasing and investment without adding an equivalent amount to U.S. production. Likewise, a decline in exports reduces measured demand for U.S.-made output without describing the performance of every exporting industry.
BEA said the faster growth rate reflected stronger investment and government spending, partly countered by a downturn in exports and a larger increase in imports. Its assessment separates the domestic pickup from the weaker contribution of trade, rather than treating the 3.4% figure as evidence that all parts of the economy improved at the same rate.
Inflation measures cool as the advance estimate awaits revisions
Price measures in the GDP report slowed from the second quarter. The price index for gross domestic purchases increased at a 3.0% annualized rate, down from 5.6%. The personal consumption expenditures price index, which measures prices for goods and services purchased by or on behalf of households, rose at a 2.1% annualized rate after a 5.0% increase in the previous quarter.
Excluding food and energy, the PCE price index increased 2.5%, compared with 3.3% in the second quarter. Those are annualized changes over the quarter, not year-over-year inflation figures. Slower growth in a price index means prices generally rose less quickly; it does not mean the overall price level declined. The GDP report therefore points to a different inflation pace during the quarter without resolving the path of prices in the months ahead.
Current-dollar GDP, which is not adjusted for inflation, increased at a 5.6% annualized rate. The distinction from 3.4% real growth matters because nominal output reflects both changes in prices and in the volume of goods and services produced. BEA’s real GDP estimate strips out price changes to provide a measure of underlying production.
Thursday’s figures are preliminary. BEA’s advance GDP estimates use source information that is incomplete or may later be revised by the agencies supplying it. Subsequent releases incorporate more comprehensive data. As a guide to how much the estimates can change, BEA reports that revisions from the advance to the second GDP estimate averaged 0.5 percentage point in absolute terms over 1996 through 2024. That historical average is not a prediction of the size or direction of this quarter’s revision.
The agency is scheduled to publish its second estimate for third-quarter GDP, along with corporate profits figures, on November 25, 2026, at 8:30 a.m. Eastern time. Those updated figures will provide a fuller test of the investment, consumption and trade picture in the initial 3.4% reading.
More News



Latest News
View all news- DoorDash Agrees to Acquire Instacart in $17 Billion Deal
- Thrive Holdings Agrees to Buy ADT for $15.3 Billion
- U.S. Continuing Jobless Claims Fall by 21,000 as New Claims Stay Low
- Freddie Mac Reports $3.2 Billion Quarterly Profit as Mortgage Portfolio Expands
- Justice Department Names New Director of Federal Bankruptcy Oversight Program
