Natural Gas Storage Data Offers Fresh Read on U.S. Energy Supply
U.S. working gas inventories rose by 16 Bcf to 3,169 Bcf in the week ended August 14, a much smaller increase than the prior week as regional draws offset gains in the East and Midwest.
Our editorial standards
MarketReview publishes clear, independently produced financial information using reliable sources and transparent editorial standards.
Read our Editorial Policy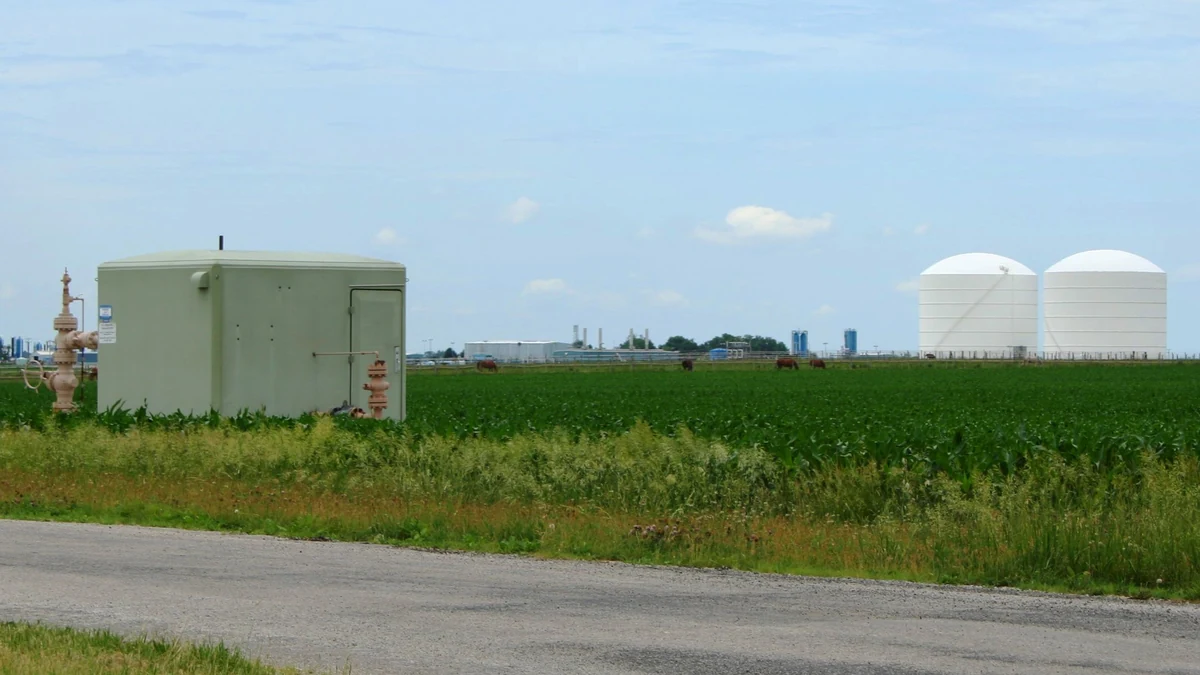
U.S. natural gas inventories rose by 16 billion cubic feet in the week ended August 14, taking working gas in underground storage across the Lower 48 states to 3,169 Bcf, according to the U.S. Energy Information Administration. The increase was much smaller than the 36 Bcf rise recorded a week earlier, giving the market a fresh indication that summer demand is limiting how quickly inventories are building even as overall supply remains ample.
The weekly change matters because storage is the buffer between production and consumption. Gas is typically injected during warmer months and withdrawn during the winter, although regional demand, pipeline flows, exports and power-sector use can alter that seasonal pattern. With the peak cooling season still underway, a smaller build can reflect stronger consumption even when production remains high.
EIA’s latest Weekly Natural Gas Storage Report shows that the national total climbed from 3,153 Bcf on August 7 to 3,169 Bcf on August 14. The same data also show that the increase was concentrated in the East and Midwest, while several western and southern regions reported lower stocks.
A smaller weekly increase slows the inventory build
The 16 Bcf rise was less than half the previous week’s increase. Storage had risen by 36 Bcf in the week ended August 7 after gaining 33 Bcf in the week ended July 31. That shift does not by itself signal a shortage, but it shows how quickly the weekly balance can tighten when weather-sensitive demand rises or when more gas is pulled toward power generation and export markets.
EIA’s regional figures show the East adding 15 Bcf, with inventories rising from 693 Bcf to 708 Bcf. Midwest stocks increased by 19 Bcf to 848 Bcf. Those gains were partly offset elsewhere. Mountain-region stocks slipped by 2 Bcf to 237 Bcf, Pacific inventories fell by 4 Bcf to 296 Bcf, and South Central stocks declined by 13 Bcf to 1,080 Bcf.
The South Central move is especially useful because that region includes a large share of the country’s salt-cavern storage, which can cycle gas in and out more quickly than traditional depleted fields. EIA data show salt inventories falling by 18 Bcf during the week, from 286 Bcf to 268 Bcf, while nonsalt stocks increased by 5 Bcf to 812 Bcf. The split illustrates that the national number can hide very different regional operating conditions.
Storage data are also not a simple measure of physical injections alone. EIA notes that changes in reported working-gas levels can reflect injections, withdrawals and reclassifications between base gas and working gas. For that reason, the week-to-week inventory change is best read as a measure of how much usable gas was in storage at the reporting dates rather than as a complete explanation of every flow that occurred during the week.
Regional draws show where summer demand is biting
The decline in South Central and Pacific inventories comes at a time when natural gas remains a major fuel for electricity generation. Hot weather can lift power-sector gas burn as air-conditioning demand increases, reducing the amount of production available to move into storage. EIA’s August Short-Term Energy Outlook says natural gas-fired electricity generation increased 2% in the first half of 2026 compared with the same period in 2025.
The regional pattern also intersects with the export market. EIA expects U.S. liquefied natural gas exports to average 16.5 Bcf per day in the third quarter. That forecast was slightly lower than the agency’s July outlook because maintenance at Freeport LNG reduced feedgas demand. EIA said the lower feedgas requirement had helped keep South Central storage above its five-year average at the end of July.
That context helps explain why one week’s South Central draw should not be read as a broad supply warning. LNG maintenance can ease demand for gas near the Gulf Coast, while electricity use can work in the opposite direction. Pipeline exports to Mexico also continue to absorb U.S. supply. EIA expects total natural gas exports to rise through 2027, adding another source of demand alongside domestic power generation.
Storage remains one of the quickest weekly indicators of how those forces are netting out. Production data arrive with a lag, while storage provides a regular snapshot of whether the system is adding to or drawing down its buffer. A sustained run of smaller-than-normal builds would gradually reduce the cushion available before winter, but a single week is not enough to establish that trend.
Record production still anchors the supply outlook
The broader U.S. supply picture remains strong. In an August 12 analysis, EIA said it expects marketed natural gas production to average a record 122.5 Bcf per day in 2026, above the previous record of 118.5 Bcf per day in 2025. Production averaged 121.3 Bcf per day in the first half of this year, up 4%, or 4.6 Bcf per day, from the same period a year earlier.
Most of that growth has been concentrated in the Permian region of Texas and New Mexico and the Haynesville region in Louisiana and Texas. Higher output gives the market more capacity to replenish inventories after periods of strong demand, although infrastructure constraints and regional pipeline availability still affect where that gas can move.
EIA’s August outlook also describes storage levels as near record highs heading into October. That assessment is one reason the agency lowered its third-quarter Henry Hub price forecast to an average of $2.87 per million British thermal units, 50 cents below its July forecast. EIA expects prices to remain below $3.00 per MMBtu in the coming months, citing robust production and the high level of inventories.
The latest weekly figures therefore add nuance rather than overturning the underlying supply story. Inventories are still high in absolute terms, and production is running at record levels, but the 16 Bcf weekly increase shows that available supply is not translating into uniformly rapid storage gains. Summer electricity demand, LNG flows, pipeline exports and regional storage operations are all competing for the same gas.
The next Weekly Natural Gas Storage Report is scheduled for August 27. Another small build, particularly if it is accompanied by further declines in South Central or Pacific inventories, would provide stronger evidence that the late-summer balance is tightening. A return to larger injections would instead reinforce EIA’s view that the United States is entering the autumn with a substantial storage cushion.
More from Investing



Latest News
View all news- FTC, USDA Launch Joint Inquiry Into Agricultural Equipment Market Practices
- VAALCO Completes Gabon Phase 3 Drilling as ETSEM-3H Starts at About 2,000 BOPD
- U.S. Crude Inventories Fall 3.2 Million Barrels in Latest EIA Report
- UK Trade Remedies Authority Proposes Five-Year Anti-Dumping Duty on Chinese Rutile Titanium Dioxide
- OCC Launches Direct Payments-Fraud Reporting Tool for Community Banks