U.S. New Home Sales Rise 6.4% to 684,000 in August
The August increase came off a sharply revised July estimate, while new-home inventory held at 483,000 and the median sales price was $393,700.
Our editorial standards
MarketReview publishes clear, independently produced financial information using reliable sources and transparent editorial standards.
Read our Editorial Policy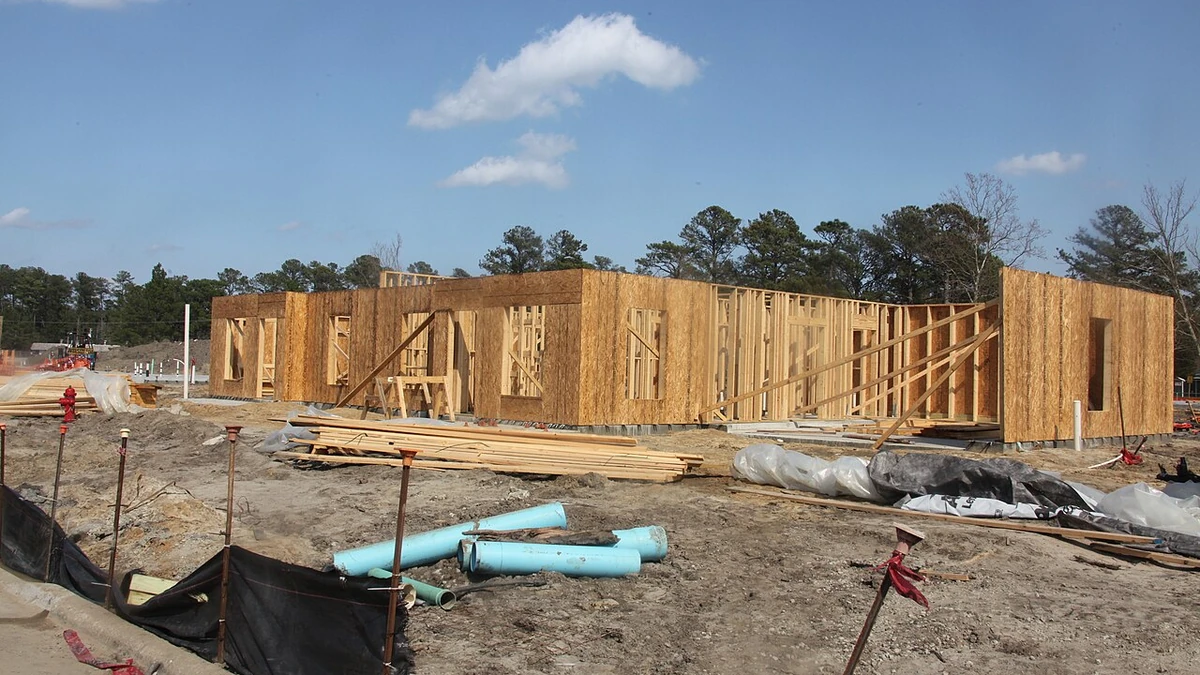
Sales of new U.S. single-family homes rose 6.4% in August to a seasonally adjusted annual rate of 684,000, according to estimates released Thursday by the U.S. Census Bureau and the Department of Housing and Urban Development. The pace was 2.0% below August 2025, when the annual rate was 698,000.
The monthly gain came from a substantially revised July base. Census now puts July sales at 643,000, up from the 607,000 rate initially reported in August. That revision means the latest increase follows a stronger prior month than first estimated and makes the 6.4% rise less dramatic than a comparison with the original July figure would suggest.
The August New Residential Sales release also showed 483,000 new homes for sale at the end of the month, unchanged from the revised July level. At the August sales pace, that inventory represented 8.5 months of supply, down from 9.0 months in July and equal to the level recorded a year earlier.
The 6.4% rise comes with a wide margin of error
The headline increase is preliminary and carries substantial statistical uncertainty. Census reported a 90% confidence interval of plus or minus 19.5 percentage points around the 6.4% month-to-month change. Because that interval includes zero, the agency’s methodology does not provide sufficient statistical evidence to conclude that the underlying monthly change was definitively positive rather than flat or negative.
That caution is especially relevant for new-home sales, which can move sharply from month to month and are revised as more survey information arrives. Census says three months of preliminary sales estimates are revised with each new release. The agency also warns that seasonally adjusted monthly figures can be irregular and that several months of data are needed before a trend can be established.
The July revision illustrates that process. When the government published its July report on August 25, it estimated new-home sales at a 607,000 annual rate. The August release revises that figure to 643,000, an increase of 36,000 from the first estimate. July inventory was also revised, with the latest report showing 483,000 homes for sale rather than the 488,000 initially reported.
Measured against a year earlier, August sales were down 2.0%, but that estimate also had a wide confidence interval of plus or minus 15.7 percentage points. The report therefore points to a higher estimated sales pace than in July, but it does not establish a clear acceleration in the broader new-home market on the basis of one month alone.
Inventory holds steady while the median price stays near $394,000
The number of new houses available for sale was essentially unchanged in August at 483,000. That was 2.0% below the 493,000 homes listed as available a year earlier. Months of supply fell because sales increased while inventory did not, moving from 9.0 months in July to 8.5 months in August. The year-earlier reading was also 8.5 months.
Months of supply measures how long the available inventory would last at the current sales pace if no additional homes were added. It can therefore fall either because builders have fewer homes available or because buyers are purchasing homes at a faster rate. In August, the decline primarily reflected the higher estimated sales pace because the inventory count itself was flat from July.
The median sales price of a new home was $393,700, up 0.4% from the revised July median of $392,200 and down 5.8% from $417,900 in August 2025. The average sales price was $478,700, down 9.1% from July’s revised $526,400 and 8.8% below the $525,100 average recorded a year earlier.
Price comparisons in the monthly report need their own caution. The median price change carried a confidence interval large enough to include zero both month to month and year over year. Census also notes that changes in reported new-home prices can reflect shifts in the mix of houses sold by region, size and other characteristics, not just price changes for otherwise identical homes. The monthly series is therefore useful for showing the price mix of completed sales, but it is not a pure measure of home-value appreciation.
Single-family construction data show an uneven pipeline
Separate Census data released a week earlier showed a mixed picture for the supply pipeline. Single-family housing starts rose 7.6% in August to a seasonally adjusted annual rate of 918,000, while single-family building permits fell 1.8% to 878,000. Single-family completions dropped 10.4% to an annual rate of 816,000.
Those figures suggest builders were starting more houses during the month even as permit authorizations eased and fewer single-family homes reached completion. As with the sales report, the monthly changes in starts and completions are subject to sampling variability, so one month does not establish a durable shift in construction activity.
With the estimated sales rate higher and for-sale inventory unchanged, builders had somewhat less inventory relative to the current pace of demand than they did in July. Even so, the stock of 483,000 homes remains large enough that pricing and incentives may continue to matter for moving unsold properties, particularly if borrowing costs keep affordability under pressure.
The next New Residential Sales report, covering September 2026, is scheduled for October 27 at 10 a.m. Eastern time. That release will provide another month of sales data and another round of revisions to the preliminary estimates, including the August figure reported Thursday.
More News


Latest News
View all news- TD SYNNEX Revenue Jumps 38% to $21.6 Billion in Record Fiscal Q3
- Sky Quarry Restarts Nevada’s Eagle Springs Refinery After Receiving Air Permit
- Darden Sales Rise 5.1% to $3.2 Billion as Restaurant Group Reaffirms Outlook
- Vertiv Agrees to Buy King Environmental Services to Expand AI Data-Center Cooling Support
- IBM Connects Digital Asset Haven to Swift Ledger for Tokenized Deposits