U.S. Leading Economic Index Falls 0.3% in October as Housing Permits Weaken
Building permits were the biggest drag on the October reading, while the index’s six-month change remained slightly positive and current-activity measures held steady.
Our editorial standards
MarketReview publishes clear, independently produced financial information using reliable sources and transparent editorial standards.
Read our Editorial Policy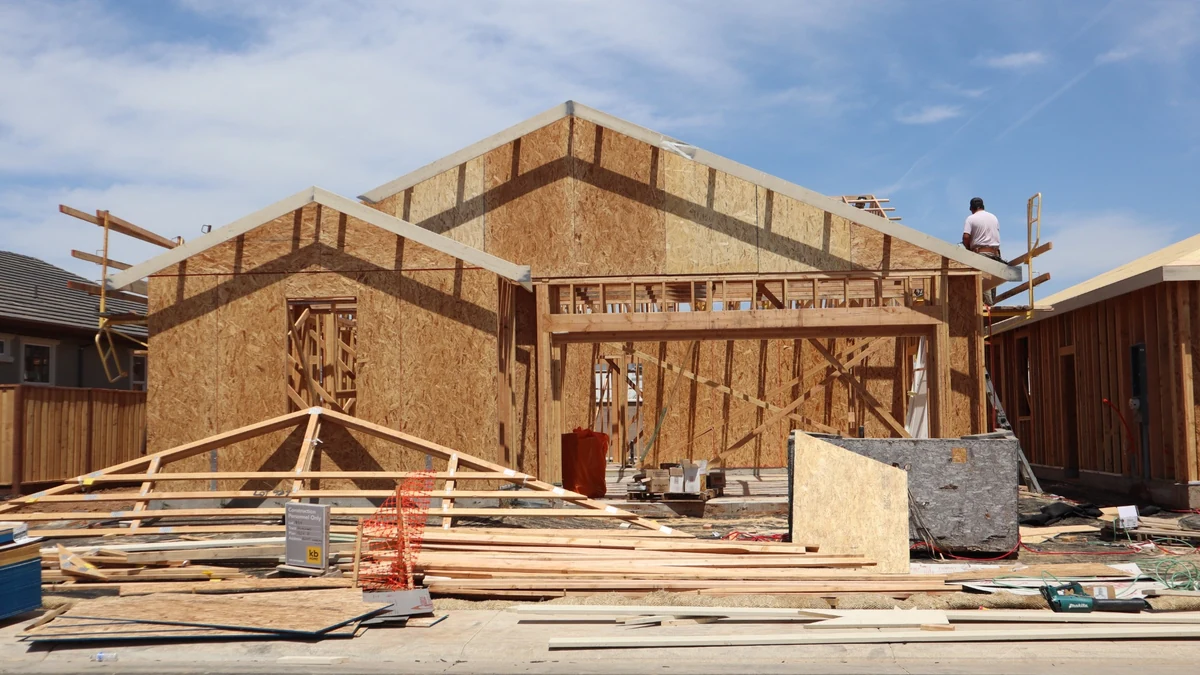
The U.S. Leading Economic Index fell 0.3% in October 2026 to 99.3, as a sharp decline in residential building permits pulled down a widely followed measure of where the economy may be headed. The October drop followed an unchanged September reading and showed how weakness in housing is weighing on an otherwise mixed set of forward-looking indicators.
The Conference Board, which compiles the index, identified building permits as the largest source of October’s decline. Less favorable consumer expectations and some manufacturing measures added to the weakness. Its report comes a day after federal data showed that permits for new homes fell markedly even as the estimated pace of housing starts rose.
The October report from The Conference Board also showed a more positive six-month trend: the index was still 0.1% higher over the six months from April through October. That modest gain followed a 0.6% decline during the previous six months, making the latest monthly drop a softer signal than the broader trend alone might suggest.
Homebuilding permits fall as construction starts rise
The Census Bureau’s October construction figures, released November 18, put privately owned housing units authorized by building permits at a seasonally adjusted annual rate of 1.295 million. That was 7.4% below the revised September pace of 1.398 million and 8.7% below the October 2025 rate of 1.418 million. The annualized figure expresses the month’s permitting activity at a yearly pace; it does not mean that 1.295 million individual permits were issued in October.
Single-family authorizations fell 8.7% from September to an annualized 772,000 units, compared with a revised 846,000 the month before. Permits for units in buildings with five or more apartments were running at an annualized 475,000. The Conference Board said the overall level of permits was the weakest since May 2020, early in the COVID-19 pandemic.
Permits are especially relevant to a leading economic index because they generally precede work on a new residential project. A developer can secure authorization before construction begins, so a sustained reduction in approvals may point to less building activity later. The link is not immediate or exact: projects can be delayed, changed or abandoned, and work underway in a given month may have been permitted much earlier.
October’s housing-starts numbers illustrate that distinction. The Census Bureau estimated starts at a 1.309 million annualized rate, up 9.9% from September’s revised 1.191 million. But the agency reported a margin of error of plus or minus 16.8 percentage points around that monthly change, meaning the estimate does not establish a statistically clear increase. A rise in the starts estimate therefore does not erase the weaker permits signal, just as the permits drop does not establish that construction already contracted by an equivalent amount.
Housing completions were estimated at a 1.272 million annual rate, up 6.5% from September, also with a wide reported margin of error. Permits, starts and completions track different stages of a building project. Keeping them separate helps explain why one set of October housing figures could appear positive while the leading index registered a negative contribution from housing.
Consumer expectations and factory indicators add pressure
Several other components contributed to October’s decline. The Conference Board said average consumer expectations for business conditions, average weekly hours in manufacturing and manufacturers’ new orders for nondefense capital goods also contributed negatively in October. The Institute for Supply Management’s new orders index made no contribution either way. Gains from other components were not enough to prevent a decline in the overall LEI.
The index is built from ten indicators spanning the household, manufacturing, credit and financial sides of the economy. Alongside permits and consumer expectations, they include weekly initial jobless claims, stock prices, an interest-rate spread and measures of manufacturing orders. Their purpose is to capture changes that may become visible in wider economic activity later, rather than simply restate growth already recorded.
Consumer expectations reflect views of coming business conditions, not a direct count of what households spent during the month. Factory hours provide a measure of how employers are using labor before broader employment data necessarily move. Capital-goods orders can offer clues about firms’ equipment demand, although one monthly reading is not enough to establish a lasting change in investment.
The 0.3% LEI decline is a monthly change in a composite index, not a forecast that gross domestic product will shrink by 0.3%. Nor does it show that every sector has weakened. The Conference Board’s analysis identifies several soft spots, with housing particularly prominent, but the results need to be read alongside measures of activity taking place now.
Current activity holds up despite softer leading signals
Current-activity measures were steadier. The Conference Board’s Coincident Economic Index was unchanged in October at 115.1, after a downwardly revised 0.1% rise in September. It advanced 0.7% between April and October, compared with 0.4% during the previous six months. Of its four components, payroll employment, personal income excluding transfers and manufacturing and trade sales made positive contributions in October; industrial production did not.
The difference between the two indexes is deliberate. The leading index looks for potential shifts ahead, whereas the coincident index tracks activity associated with the present phase of the business cycle. The Lagging Economic Index, which tracks indicators that tend to respond later, was also unchanged in October, at 121.3. Taken together, the data describe a more cautious outlook than the current-activity numbers alone would indicate, rather than a confirmed recession.
For the full year, The Conference Board forecasts real U.S. GDP growth of 2.3% in 2026 and 2.1% in 2027. Those are the organization’s projections, not reported outcomes. Its assessment is that continued expansion will rely increasingly on investment even as household demand softens. The weaker October permits reading is consistent with pressure on one investment-sensitive sector, but it does not establish the path of overall growth.
More housing evidence is due before the next leading-index reading. The Census Bureau has scheduled its November residential construction report for December 17, with The Conference Board’s next U.S. LEI release set for December 18 at 10 a.m. Eastern time. Those updates will show whether the latest drop in permits persists and whether the other forward-looking components continue to offset one another.
More News



Latest News
View all news- Walmart Raises Full-Year Outlook After Revenue Climbs 5.2% in Third Quarter
- RBI Absorbs ₹11,682 Crore Through Reverse Repo Auction at 5.49%
- GAO Questions Cost Controls on $45 Billion U.S. Immigration Detention Funding
- U.S. Jobless Claims Rise to 203,000 as Continuing Claims Jump by 70,000
- Williams-Sonoma Reports 21% EPS Growth, Helped by Tariff Refunds