
U.S. Home Prices Rise 2.1% Year Over Year as FHFA Data Show Growth Cooling
FHFA’s purchase-only index rose 0.3% in the second quarter, but June prices were flat and regional performance split sharply between stronger Midwest and Northeast markets and weaker parts of the West.
Our editorial standards
MarketReview publishes clear, independently produced financial information using reliable sources and transparent editorial standards.
Read our Editorial Policy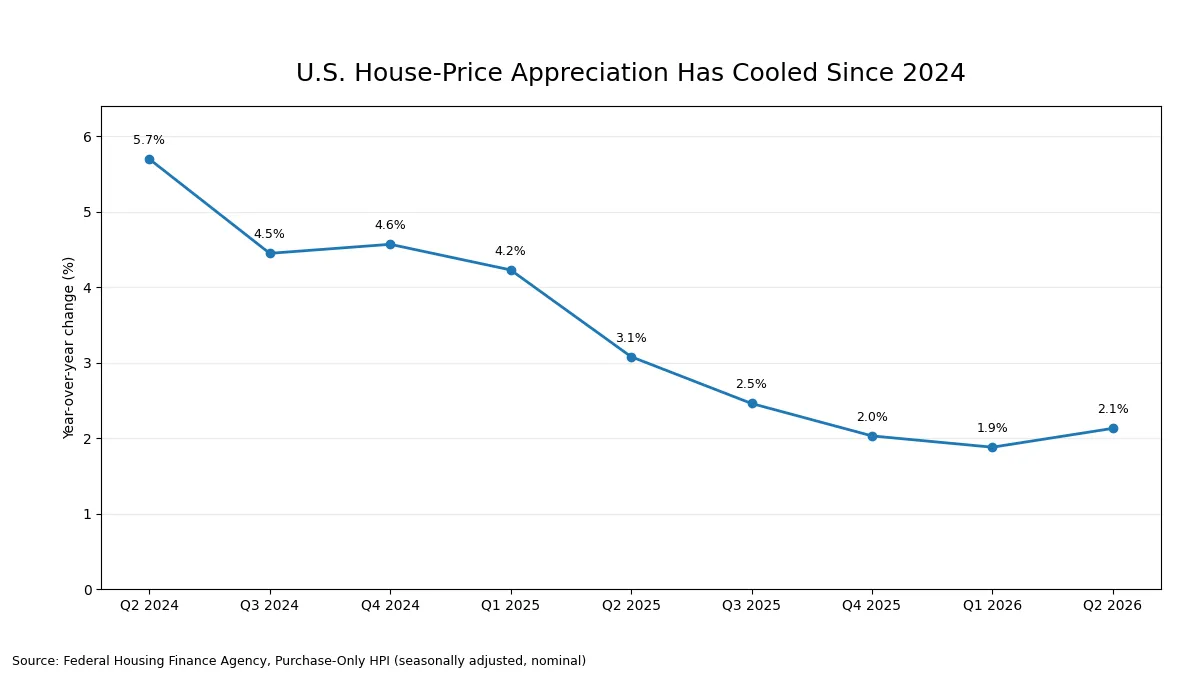
U.S. home prices rose 2.1% in the second quarter from a year earlier, extending a long run of national appreciation even as the latest Federal Housing Finance Agency data showed slower momentum within the quarter. Prices increased 0.3% from the first quarter on a seasonally adjusted basis, and FHFA’s monthly index was unchanged in June from May.
The annual rate was slightly stronger than the 1.9% increase recorded in the first quarter, so the latest report does not show a renewed nationwide decline. The broader trend is still much cooler than a year earlier: annual appreciation was 3.1% in the second quarter of 2025, while quarter-to-quarter growth slowed from 0.6% in the first three months of 2026 to 0.3% in the second.
FHFA said prices increased in 46 states and the District of Columbia over the year, and 76 of the 100 largest metropolitan areas also posted gains. The agency’s August 25 house-price release shows a market that remains positive nationally but has become much more uneven across regions, with parts of the Midwest and Northeast outperforming several Western markets.
Quarterly momentum slows as June prices flatten
The quarterly series gives the clearest evidence of cooling in the latest report. FHFA’s purchase-only index rose 0.35% in the second quarter, down from 0.57% in the first quarter and 0.86% in the fourth quarter of 2025. Expressed at an annualized rate, the second-quarter increase was 1.39%, compared with 2.29% in the first quarter.
Monthly data show a similarly subdued finish to the quarter. U.S. prices rose 0.3% in May after falling 0.1% in April, then were essentially unchanged in June. The monthly index stood at 442.5 in June, compared with 442.4 in May, and was 2.3% above its June 2025 level. That 2.3% monthly year-over-year reading differs from the 2.1% headline figure because the latter compares quarterly index values rather than the single month of June.
The longer view also points to a marked deceleration from the rapid gains seen earlier in the decade. FHFA’s quarterly annual appreciation rate was 5.7% in the second quarter of 2024, then eased to 4.5% in the third quarter and 4.6% in the fourth. It fell to 4.2% in the first quarter of 2025, 3.1% in the second, 2.5% in the third and 2.0% in the fourth before reaching 1.9% in the first quarter of 2026 and 2.1% in the latest period.
FHFA’s flagship index does not measure the median price of homes sold. It is a repeat-sales index built from conventional, conforming mortgages purchased or securitized by Fannie Mae and Freddie Mac, which allows the agency to track changes in values for the same properties over time. The figures in the quarterly report are seasonally adjusted and nominal, so they are not adjusted for consumer-price inflation.
Midwest and Northeast lead as Pacific markets lag
Regional differences were wide. The East North Central division, which includes Illinois, Indiana, Michigan, Ohio and Wisconsin, recorded the strongest annual gain at 4.5%. The Middle Atlantic followed at 3.9% and New England at 3.8%, while the Pacific division was nearly flat at 0.02% over the year and fell 0.4% from the first quarter.
Alaska led the states with an 8.3% annual increase, followed by Vermont at 7.3%, Hawaii at 5.8%, Illinois at 5.6% and West Virginia at 5.6%. Four states posted annual declines: California fell 0.2%, Colorado 0.5%, Washington 0.9% and New Mexico 1.2%. The geographic split shows that the national 2.1% increase masks very different local price paths.
The metropolitan rankings were similarly divided. Elgin, Illinois, had the strongest annual gain among the 100 largest areas at 7.7%, followed by Allentown-Bethlehem-Easton at 7.0% and Bridgeport-Stamford-Danbury at 6.6%. At the other end, Everett, Washington, fell 3.7% from a year earlier, while San Antonio-New Braunfels dropped 3.0% and Bakersfield-Delano declined 2.6%.
Several large Western technology and coastal markets also recorded annual declines. FHFA reported decreases of 2.4% in both Seattle-Bellevue-Kent and San Francisco-San Mateo-Redwood City, 1.6% in San Jose-Sunnyvale-Santa Clara and 1.0% in Denver-Aurora-Centennial. Those readings contrast with stronger appreciation in Chicago, New York-area divisions, Cleveland and other markets farther east.
High borrowing costs and softer new-home sales frame the slowdown
Home-price growth is cooling against a backdrop of still-expensive mortgage financing. Freddie Mac’s Primary Mortgage Market Survey put the average 30-year fixed mortgage rate at 6.65% for the week ended August 20, slightly above 6.58% a year earlier. The rate had declined for two consecutive weeks, but it remained high enough to keep monthly payments elevated for buyers financing homes at today’s prices.
A separate Census Bureau and Department of Housing and Urban Development release on August 25 also pointed to soft demand in the new-home market. The agencies estimated July sales of new single-family houses at a seasonally adjusted annual rate of 607,000, down 10.5% from the revised June pace of 678,000, although the reported margin of error means the monthly sales decline was not statistically established at the stated confidence level.
New-home inventory was estimated at 488,000 units at the end of July, 1.9% above June. The median sales price was $393,800, down from $403,100 in June, though the Census release likewise showed a wide margin of error around that monthly price change. Those figures cover newly built homes rather than the broader stock of properties reflected in FHFA’s repeat-sales measure, but they add context to the slower price momentum.
For homeowners, slower appreciation means equity is still rising nationally on average, but at a much gentler pace than during the strongest post-pandemic years. For buyers, softer price growth does not automatically restore affordability when mortgage rates remain above 6% and local markets can diverge sharply from the national average.
FHFA will publish its next monthly House Price Index on September 29 with data through July. The next quarterly report, covering the third quarter and monthly data through September, is scheduled for November 24, providing the next broader test of whether the second-quarter slowdown extends into the second half of 2026.
More News


Latest News
View all news- JPMorgan Reports $15.3 Billion Third-Quarter Profit as Revenue Hits $50.2 Billion
- Johnson & Johnson Raises 2026 Sales Outlook After $25.4 Billion Third-Quarter Revenue
- IMF Raises Global Growth Forecast to 3.1% as AI Investment Supports the U.S. Outlook
- Goldman Sachs Posts $5.29 Billion Q3 Profit and $17.01 Earnings Per Share
- FTC Seeks Contempt Sanctions Against Martin Shkreli Over Alleged Biotech Stock Trading
