
Australian Filled Jobs Rise 0.7% as Multiple Job-Holding Hits Record High
Filled jobs increased by 110,700 in the June quarter, while the multiple job-holding rate reached a record 6.9% as secondary work grew much faster than main jobs.
Our editorial standards
MarketReview publishes clear, independently produced financial information using reliable sources and transparent editorial standards.
Read our Editorial Policy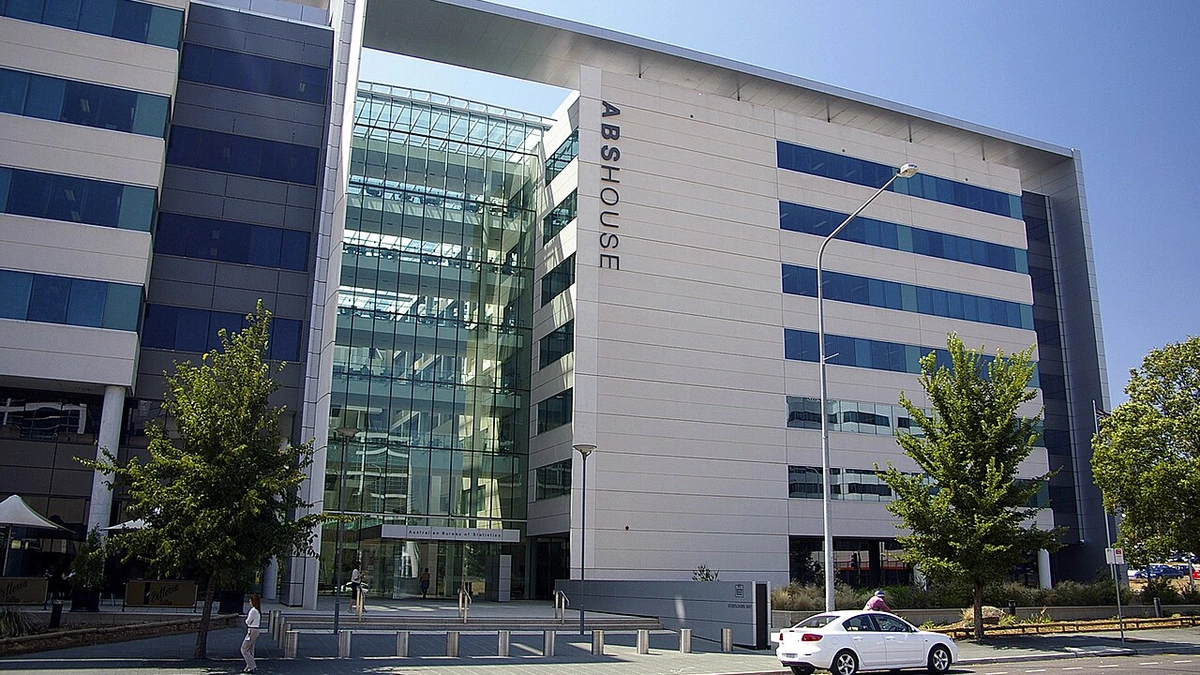
Australia’s filled jobs rose by 110,700, or 0.7%, to 16.323 million in the June quarter, extending the increase in jobs to a fifth consecutive quarter. The gain was accompanied by a sharper rise in people working more than one job, with multiple job-holders increasing 6.6% to 1.0491 million.
The multiple job-holding rate climbed 0.4 percentage points to 6.9%, the highest level since the series began in September 1994. At the same time, secondary jobs grew much faster than main jobs, pointing to a quarter in which additional work arrangements contributed materially to the increase in the number of filled positions.
The Australian Bureau of Statistics’ June-quarter Labour Account showed employed people rising 0.4% to 15.168 million, slower than the 0.7% increase in filled jobs. The distinction matters because a person can hold one main job and one or more secondary jobs, so the number of jobs can rise faster than the number of people employed.
Secondary jobs outpaced growth in main jobs
Secondary jobs increased by 51,500, or 4.6%, in the June quarter to 1.1639 million. Main jobs rose by 59,200, or 0.4%, to 15.1591 million. Secondary jobs therefore accounted for almost half of the quarterly increase in filled jobs even though they represented only 7.1% of all filled jobs at the end of the quarter.
The difference was even clearer over the year. Secondary jobs were up 11.7%, an increase of 122,000, while main jobs rose 1.9%, or 288,400. ABS said the stronger secondary-job growth coincided with Labour Force data showing part-time employment growing 1.0% compared with 0.3% for full-time employment. Average hours worked per job fell 0.3% as a result, even though total hours actually worked across the economy rose 0.4% to 6.13 billion hours.
Secondary work was concentrated in several large service industries. Health care and social assistance had 207,100 secondary jobs, the highest total among industries, followed by administrative and support services with 158,500 and education and training with 131,500. Accommodation and food services had 126,000 secondary jobs and retail trade had 110,900. Those figures describe where secondary jobs were held, but they do not identify why workers took on additional employment.
Multiple job-holding rate reaches a record 6.9%
The number of multiple job-holders increased by about 64,900 from the March quarter, when the seasonally adjusted total was 984,200. Compared with the June quarter of 2025, the latest level was 103,700 higher, an 11.0% annual increase. The record 6.9% rate means roughly one in fourteen employed people held more than one job during the quarter.
For much of the preceding year, the multiple job-holding rate had moved within a narrow range. It was 6.4% in June 2025 and then 6.5% in each of the September 2025, December 2025 and March 2026 quarters before moving to 6.9% in June 2026. That makes the latest increase a distinct step up in the seasonally adjusted series rather than a continuation of small quarter-to-quarter changes.
These data should not be treated as evidence of a single economic motive. The Labour Account measures the number of people with multiple jobs and the number of secondary jobs, but it does not by itself establish whether workers added jobs because of household costs, scheduling preferences, career choices or other circumstances. A person can also hold more than one secondary job, which is why the number of secondary jobs exceeds the number of multiple job-holders.
Private-sector jobs rise as vacancies move lower
Private-sector filled jobs increased 0.8% in the quarter, also marking a fifth consecutive quarterly rise, while public-sector filled jobs were unchanged. ABS said health care and social assistance and construction were the main contributors to private-sector growth, with private filled jobs in those industries rising by 24,400 and 13,700 respectively. Over the year, private-sector filled jobs increased 2.9%, or 386,900, compared with a 1.1%, or 25,200, rise in the public sector.
Vacancies moved in the opposite direction. Job vacancies fell by 8,800, or 2.6%, to 333,500, taking the proportion of total jobs that were vacant down to 2.0%. Total jobs, which include filled positions and vacancies, still rose by 101,900, or 0.6%, to 16.6565 million because the increase in filled jobs more than offset the decline in vacancies.
Labour income also increased during the quarter. Total labour income rose 1.3% to $395.647 billion, while average labour income per employed person increased 0.9% to about $26,084. Total labour costs were up 1.2% to $421.103 billion. Those measures broaden the picture beyond job counts, showing that aggregate labour payments continued to rise alongside employment and hours worked.
The June-quarter figures remain subject to revision. ABS said the latest industry benchmark data in the Labour Account are for the 2023-24 financial year, and estimates from the September 2024 quarter onward may change as more definitive information replaces indicator data. The agency is scheduled to publish a separate June-quarter Multiple job-holders release on September 11, along with an update to the Labour Account containing new sex and age-group breakdowns.
More News



Latest News
View all news- Five Tradr Leveraged ETFs Reach October 20 Trading Suspension Date on Cboe
- SEC and French Regulator Sign Oversight Agreement for Cross-Border Investment Advisers
- NCUA Proposes Easing Three Credit Union Rules, Including Investment Reserve Requirements
- Instacart Agrees to $5 Million Settlement Over U.S. Hiring Discrimination Allegations
- GM Authorizes $20 Billion Share Buyback After Reporting $3.3 Billion Quarterly Profit
