Australian Household Spending Rebounds 0.6% in September as Fuel Costs Rise
Australian household spending rose 0.6% in September after a small August decline, with higher fuel costs and gains in transport, health and recreation lifting the monthly indicator.
Our editorial standards
MarketReview publishes clear, independently produced financial information using reliable sources and transparent editorial standards.
Read our Editorial Policy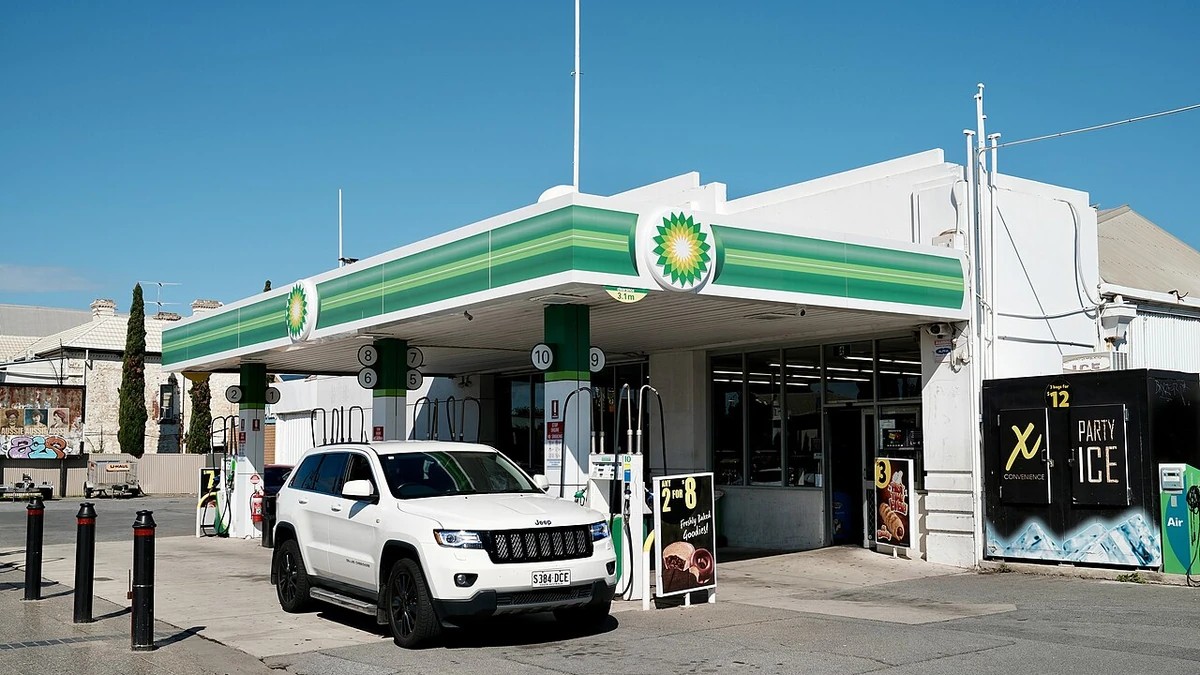
Australian household spending rose 0.6% in September, recovering from a 0.1% decline in August, as higher fuel costs and firmer spending on transport, health and recreation lifted the monthly reading. The rebound, reported Wednesday by the Australian Bureau of Statistics, added to evidence that consumer outlays continued to grow through the September quarter even as cost pressures remained a major part of the story.
The monthly increase was broad enough to show improvement across both essential and discretionary categories, but the detail matters. A large jump in fuel spending helped push transport higher, and the ABS said that reflected rising global oil prices and the end of temporary fuel excise relief. Experimental ABS data also indicated that fuel spending volumes fell 2.2% in September, which suggests households were paying more at the pump rather than buying more fuel.
Fuel prices helped drive the monthly rebound
In its September household spending release, the ABS said spending increased across key categories, with transport and health both up 1.5% and recreation and culture up 0.8%. Hotels, cafes and restaurants rose 0.5%, miscellaneous goods and services increased 0.6%, and clothing and footwear edged up 0.1%. The broad total therefore returned to growth after the small pullback recorded in August.
Transport was one of the most important contributors to the monthly rebound. The ABS said the category was lifted by higher spending on fuel, vehicle repairs and maintenance, and domestic air travel as people traveled to attend major sporting events. Fuel spending alone rose 5.4% in September, one of the sharpest category-level moves in the release. That jump came as global oil prices moved higher and Australia no longer had the support of the temporary fuel excise relief that ended on Aug. 3.
The fuel data are also a reminder that nominal spending and underlying volumes can tell different stories. Because the indicator is published in current prices, higher prices can lift the spending total even when the amount purchased is flat or falling. The ABS said its experimental estimate showed fuel volumes fell 2.2% in September. For readers trying to assess household demand, that means part of the headline rebound reflected price pressure rather than a pure increase in consumption.
Other categories were more mixed. Food spending fell 0.1% in September, alcoholic beverages and tobacco dropped 0.7%, and furnishings and household equipment slipped 0.2%. Even so, gains elsewhere were large enough to offset those declines. Health spending rose 1.5%, while recreation and culture increased 0.8%, suggesting that consumers were still spending on a range of services and discretionary activities despite cost-of-living strain.
Quarterly growth remained intact, though the indicator has limits
The September result also rounded out another quarter of growth in the ABS household spending indicator. In volume terms, seasonally adjusted household spending rose 0.7% in the September quarter, marking a fourth straight quarterly increase. Transport posted the strongest quarterly gain at 1.6%, followed by clothing and footwear at 1.2% and health at 1.1%.
That quarterly measure is important because it adjusts for price effects and offers a cleaner read on underlying activity than the current-price monthly number alone. The current-price indicator showed total spending at A$82.61 billion in September on a seasonally adjusted basis, up 6.8% from a year earlier. In trend terms, spending was A$82.37 billion, up 0.4% from August and 6.0% from a year earlier. The combination points to continued expansion in household outlays, but not every part of the increase reflects a stronger real volume of purchases.
The ABS also noted that spending on services rose 1.1% month over month in current-price terms, driven by air passenger and sea transport, total health services, and recreational and cultural services. That makes the September rebound look somewhat healthier than a headline driven by petrol alone. Still, transport remained the biggest story, and a good share of that category’s monthly increase came from fuel costs rather than unambiguously stronger demand.
Readers should also keep in mind what this indicator does and does not cover. The Monthly Household Spending Indicator draws on aggregated card transactions, supermarket scanner data and motor vehicle sales data. It covers nine of the 13 key household consumption divisions under the COICOP framework. Housing, water, electricity, gas and other fuels, communications, and education services are excluded. As a result, the series is a useful timely signal on consumer behavior, but it is not a full measure of total household consumption in the same way as the national accounts.
State data and cost pressures shape the consumer picture
At the state and territory level, the quarterly volume figures showed a varied picture. Western Australia recorded the strongest increase in the September quarter at 1.4%, while the Northern Territory rose 2.0% after an already strong June quarter. Victoria increased 0.9%, New South Wales and Queensland each rose 0.5%, and South Australia advanced 0.4%. Tasmania slipped 0.1% and the Australian Capital Territory fell 0.3%.
Those regional differences underline how uneven household conditions can be, even when the national headline is positive. The September reading suggests consumers were still spending, particularly on travel-related activities and health services, yet the role of higher fuel prices shows that inflation-linked pressures have not disappeared from household budgets. A rise in transport spending is not automatically a sign that households feel more comfortable. In this case, a higher bill at the petrol station was a meaningful part of the increase.
For economists and investors, the release adds another piece to the picture of Australian domestic demand late in the third quarter. A fourth consecutive quarterly rise in volume terms suggests consumption did not stall. At the same time, softer categories such as food and household equipment, plus the decline in fuel volumes, argue for some caution in reading too much into one month of current-price growth. The data are more consistent with a consumer sector that is still spending, but doing so under ongoing price pressure and with uneven momentum across categories.
The ABS is scheduled to publish the October Monthly Household Spending Indicator on Nov. 30. That report should help show whether September’s rebound was the start of a firmer run in spending or a partial bounce shaped largely by temporary fuel-price effects and event-related travel.
More News

Latest News
View all news- Spain’s Sánchez Proposes Bank Tax Extension to Raise €1.4 Billion for Housing
- Canada Announces C$248,063 Investment to Restore Nova Scotia Lighthouse and Support Tourism
- New York’s New CPA Licensing Law Takes Effect, Adding 120-Credit Pathway
- Nasdaq Rule Removing CORE FIX Order-Entry References Becomes Operative
- Monte dei Paschi Calls Intesa Takeover Offer Financially Fair but Says It Undervalues Future Potential