BEA Expands State-Level R&D Economic Statistics With New 2024 Estimates
The Bureau of Economic Analysis updated its experimental state-level research and development data with revised 2023 figures and new 2024 estimates, extending a young data set that tracks R&D's contribution to GDP, jobs, and pay across all 50 states and Washington, D.C.
Our editorial standards
MarketReview publishes clear, independently produced financial information using reliable sources and transparent editorial standards.
Read our Editorial Policy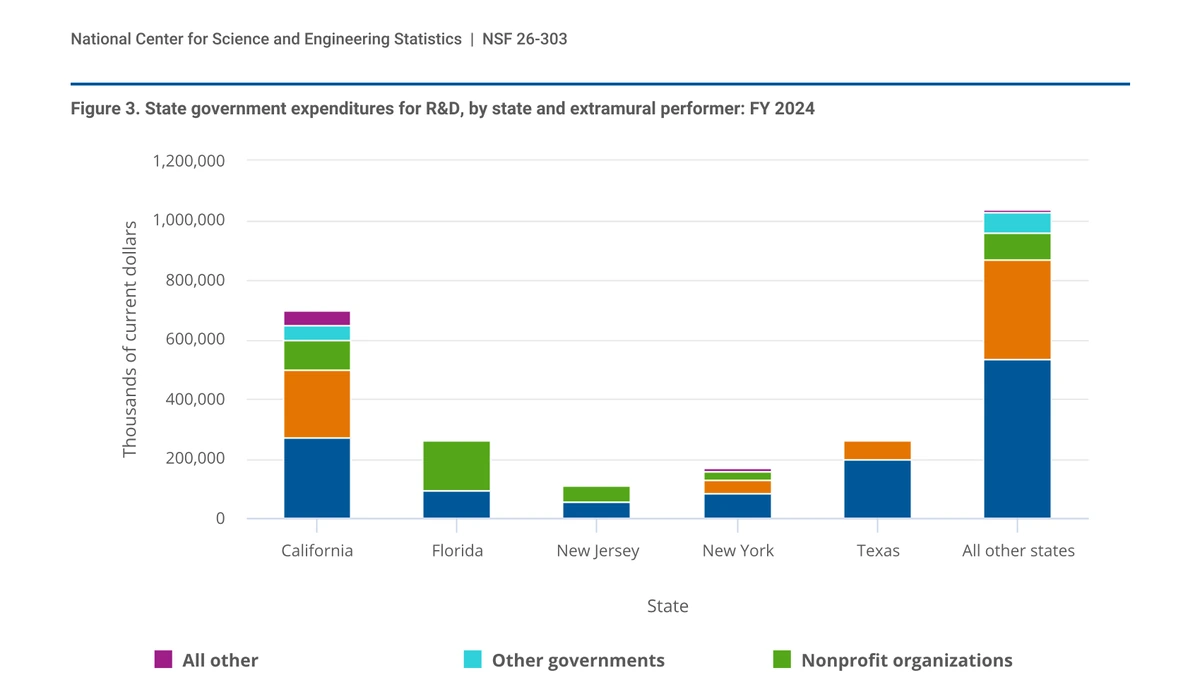
The Bureau of Economic Analysis on Thursday expanded its state-level research and development statistics with revised 2023 data and new estimates for 2024, giving policymakers, businesses, and regional analysts a more current view of how research activity contributes to state economies.
The update extends one of BEA’s newer experimental data sets, which is designed to show not just how much money is spent on research, but how much economic activity R&D production generates, how many jobs it supports, and how much compensation those jobs pay. The statistics cover the nation, all 50 states, and the District of Columbia.
That makes the release more than a routine table refresh. State officials, universities, development agencies, investors, and industry groups frequently talk about research capacity as a growth driver, but standard state GDP reports do not break out R&D as its own sector. BEA’s satellite-account approach is meant to fill that gap and make state comparisons easier inside the same accounting framework used for gross domestic product and related measures.
BEA pushes its experimental state R&D account into 2024
According to BEA’s research and development statistics page, the agency released updated data for 2023 and added data for 2024 in October 2026. That builds on an earlier rollout in May 2024, when BEA first published experimental national and state figures covering 2017 through 2021, and on a September 2025 expansion that pushed the series back to 2012 and added 2022 and 2023.
The practical effect is that a once-limited pilot series is becoming more useful as a tracking tool. A four- or five-year window can show how concentrated R&D activity is, but it is less helpful for anyone trying to judge current momentum in areas such as life sciences, semiconductors, software, defense-related research, or university-linked innovation clusters. By adding 2024 estimates and revising 2023, BEA has brought the state series closer to the timeline readers expect from other economic releases.
The agency describes the statistics as experimental, which matters. Experimental data are published for use and scrutiny, but the methods and presentation may continue to evolve. BEA is actively seeking public feedback on the measures, suggesting that the agency still sees the satellite account as a developing product rather than a finished benchmark series.
Even so, the release marks a meaningful step in the maturation of the data. State-level economic statistics often lag because they depend on a wide range of source material and on reconciliation across agencies and survey systems. The R&D account adds another layer of complexity because it combines survey-based research data with BEA’s national accounting framework.
What the statistics measure, and why that distinction matters
BEA’s R&D statistics do not simply restate research spending totals. The agency says the data measure the contribution of research and development to the economy through three lenses: value added, employment, and compensation. Value added is the piece most closely aligned with GDP. It reflects the economic value generated in production after subtracting intermediate inputs such as energy, materials, and purchased services used up in the process.
That distinction is important because it separates R&D production from R&D investment or funding. A state may host a large amount of research activity funded by federal agencies, large companies, or nonprofit institutions, but the production-based statistics ask where the research is actually performed and what value it creates there. In BEA’s framework, R&D activity is attributed to the state where the work takes place, not necessarily to the state where the company is headquartered or where the funding originated.
The same logic applies to employment and compensation. The jobs measure tracks full-time and part-time wage and salary jobs involved in producing R&D, and compensation captures the wages, salaries, and supplements tied to that work. For state analysts, that is useful because it helps distinguish between places that merely attract research dollars and places where research activity directly supports payrolls and production.
Those distinctions also help explain why BEA’s release should not be confused with broader R&D spending tables from other agencies. A spending measure can answer who financed research and how much was spent. BEA’s value-added approach is intended to show how research functions as an economic sector inside the larger economy, which makes it more comparable to other GDP-style statistics.
The expanded state view arrives as U.S. R&D remains large and concentrated
The timing of the update is notable because the broader U.S. research base is still large by historical standards. In a separate official release, the National Center for Science and Engineering Statistics said domestic R&D performance totaled $937 billion in 2023 and was expected to rise to $993 billion in 2024. Those figures are not the same as BEA’s R&D value-added estimates, but they show why a richer state-level economic lens is attracting more attention.
Earlier BEA results already illustrated how unevenly research activity is distributed across the country. When the agency first published the statistics in 2024, it said the top ten R&D-producing states accounted for 70 percent of U.S. R&D value added in 2021, with California alone contributing almost a third. Washington, Massachusetts, Texas, and New York were also among the largest states on that measure.
Scale and intensity do not always point to the same places, which is part of the reason the BEA series is useful. Large states naturally dominate in dollar terms, but smaller or more specialized states can stand out when R&D is measured relative to the size of the local economy. In BEA’s first state release, New Mexico had the highest R&D value-added share of state GDP in 2021, reflecting the outsized role of federally connected research activity there.
The newly added 2024 estimates should help users see whether those patterns are holding, broadening, or becoming more concentrated. That matters for state development strategies, university research planning, federal grant positioning, and industry decisions about where high-value technical work is already clustered. It also matters for readers trying to interpret state growth stories more carefully. Fast GDP growth and a strong labor market do not necessarily mean a state has a large R&D base, and a strong R&D footprint does not automatically show up clearly in traditional industry summaries.
For now, BEA’s message is straightforward: the data set is getting deeper, more current, and more useful. The agency’s October update does not settle every question about how best to measure research activity, but it gives the public a better state-by-state starting point. Readers who want to compare R&D across states in a GDP-consistent framework now have a longer series to work with, and one that reaches into 2024 rather than stopping short of the latest year.
BEA is continuing to host the full data, documentation, and contact information on its R&D product page, where it is also inviting feedback on the experimental statistics.
More News


Latest News
View all news- Union Pacific Third-Quarter Profit Rises 16% to $2.1 Billion as Freight Volumes Grow
- Nasdaq Q3 Revenue Jumps 13% as Annual Recurring Revenue Reaches $3.4 Billion
- Census Bureau Releases New Business Conditions Data Covering U.S. Employers
- Blackstone Reports Third-Quarter Earnings With Assets Under Management Near $1.4 Trillion
- Sweden’s Economy Grows 3.8% as Greenhouse Gas Emissions Decline, New Data Show