U.S. Homebuilder Confidence Drops to 14-Year Low as Nearly Half of Builders Cut Prices
Buyer traffic weakened across the country as mortgage rates above 7% and elevated construction costs prompted more builders to offer discounts and incentives.
Our editorial standards
MarketReview publishes clear, independently produced financial information using reliable sources and transparent editorial standards.
Read our Editorial Policy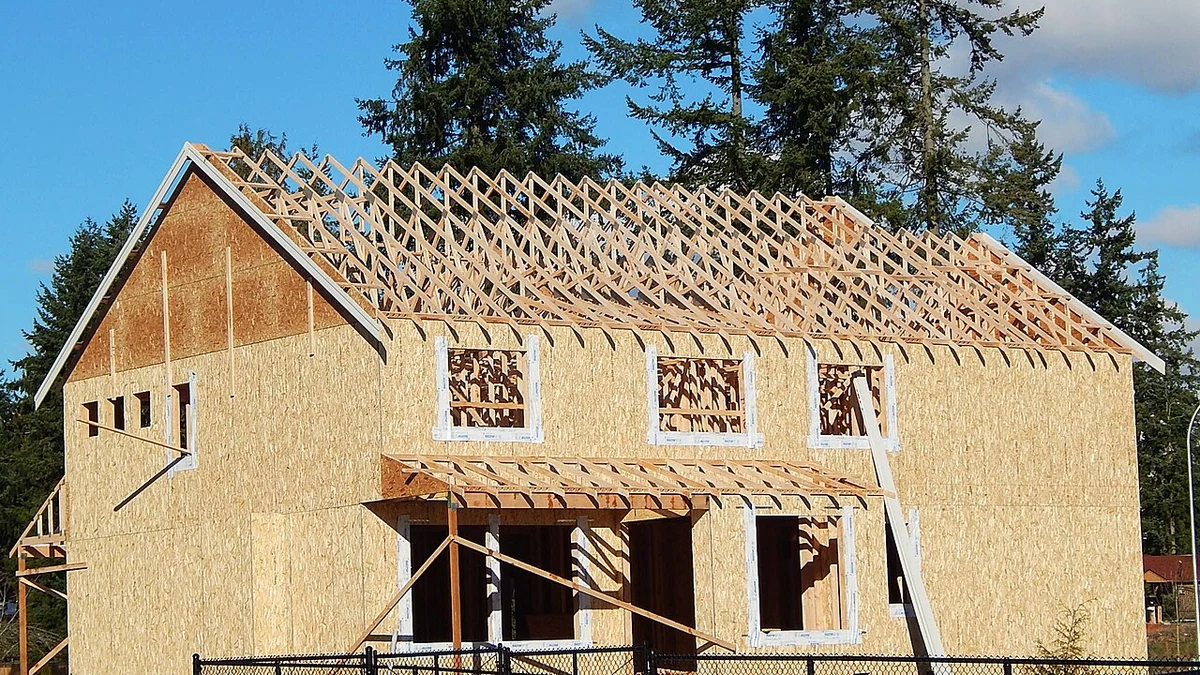
U.S. homebuilder confidence dropped to its lowest level in more than 14 years in November as weak buyer demand pushed a growing share of builders to cut prices. The National Association of Home Builders (NAHB)/Wells Fargo Housing Market Index fell four points to 25, its lowest reading since April 2012.
The decline followed a three-point drop in October and showed up across every component of the monthly survey. Builders reported weaker assessments of current sales, lower expectations for the next six months and fewer prospective buyers visiting new-home developments. The 0-to-100 index measures sentiment among builders of newly constructed single-family homes; a reading below 50 indicates that more respondents view conditions as poor than good.
Price cuts reach a post-pandemic high
Price reductions have become a prominent response to the slowdown. In its November builder-confidence release, NAHB said 46% of surveyed builders reduced home prices, the highest share since the COVID-19 pandemic. That compares with 43% in October. The average reported price reduction was 6%, unchanged for the eighth consecutive month.
Discounting is not the only way builders are trying to support sales. The share offering incentives increased to 68% from 65% in October, also a post-pandemic high. At least 60% of builders have used sales incentives for 20 straight months, according to NAHB. That persistence suggests concessions are no longer a brief response to a weak selling season; they have become a regular part of selling newly built homes in a difficult financing environment.
The distinction between a price reduction and an incentive matters. A builder can lower the advertised price of a house or offer assistance intended to reduce a buyer’s upfront or ongoing financing costs. Both may improve the affordability of an individual purchase, but they affect the buyer’s finances differently. Builders also have to weigh the cost of concessions against construction expenses that remain elevated.
The 46% figure represents the share of builders reporting price cuts, not the proportion of all newly built homes sold at a discount. Nor does it establish that home prices nationally fell by 6%. NAHB’s survey provides evidence of how builders are responding to demand, rather than a measure of completed home-sale prices. Its findings are especially relevant because builders can adjust prices and incentives on unsold inventory without waiting for homeowners to list existing properties.
Buyer traffic weakens across the country
All three measures used to calculate the headline confidence index weakened. The index of current sales conditions declined six points to 28, while expectations for sales over the next six months slipped two points to 30. Prospective-buyer traffic fell two points to 16. NAHB said the traffic reading was the weakest in 15 years apart from the initial pandemic disruption in 2020.
That traffic measure helps explain why price concessions are spreading. A builder may be willing to negotiate on a home already under construction, but discounts can do little if prospective purchasers are not visiting developments or cannot qualify for financing. Low traffic also gives builders less visibility into how quickly a planned community will sell, complicating decisions about when to start the next phase of work.
The weakness was not confined to one region. On a three-month moving-average basis, builder confidence fell four points to 34 in the Northeast and five points to 35 in the Midwest. The South declined three points to 27, while the West slipped three points to 23. Those regional figures smooth monthly survey movements; they do not measure regional changes in the number of homes actually started.
Other housing indicators point to a similarly cautious buyer market, although they measure different activity. The National Association of Realtors reported that sales of previously owned homes fell 5.5% in October to a seasonally adjusted annual rate of 3.75 million. Sales were 8.8% below the year-earlier level. The supply of existing homes for sale rose to 5.1 months at October’s selling pace, compared with 4.7 months in September.
Existing-home sales are based on closed purchases, whereas the NAHB survey asks builders to assess current conditions and future prospects for new homes. The two measures should not be treated as interchangeable. Taken together, however, they show that slower activity is affecting more than one part of the residential market.
Mortgage rates and construction costs add pressure
Financing remains a central constraint. Freddie Mac’s Primary Mortgage Market Survey showed the average 30-year fixed mortgage rate at 7.11% on November 12, down from 7.18% a week earlier. Rates had declined for four consecutive weeks, but the latest reading was still well above the 6.24% average recorded a year earlier.
For households borrowing a large share of a home’s purchase price, that difference raises the monthly payment on a comparably sized loan. It can also narrow the range of homes for which a buyer qualifies. The recent decline in weekly rates therefore offers some relief without erasing the affordability pressures that accumulated earlier in the year. NAHB chief economist Robert Dietz cited mortgage rates above 7% and weaker consumer confidence among the forces restraining demand.
Builders face a separate cost problem when they decide whether to offer deeper discounts. An NAHB review of federal producer-price data published on November 16 found that the index for goods used in new residential construction was 9.8% higher in October than a year earlier. When goods and services were considered together, inputs to new residential construction were up 10.4% year over year. Higher costs leave less room to reduce selling prices while maintaining expected margins.
NAHB chairman Bill Owens also pointed to labor shortages and rising fuel costs for subcontractors, saying that stepped-up immigration enforcement was discouraging some legal workers from reporting to job sites. Those are the trade group’s assessments of pressures facing members, not separate findings from the confidence index about nationwide employment levels. Dietz likewise cited tariffs on building materials and regulatory expenses as obstacles to improving housing affordability.
Recent government construction data provide a check on the slowdown, but they lag the November sentiment survey. The Census Bureau reported that single-family housing starts ran at a seasonally adjusted annual rate of 859,000 in September, compared with a revised 900,000 in August. Single-family building permits were at an annual rate of 845,000, down from 880,000 the previous month. Both are estimates of activity, rather than measurements of how builders feel about future demand.
The next test will arrive with the Census Bureau’s scheduled October new-residential-construction report on November 18. Its figures for permits and housing starts will offer a more direct look at whether the caution reflected in builders’ surveys has been accompanied by further changes in construction activity.
More News


Latest News
View all news- Spain’s Sánchez Proposes Bank Tax Extension to Raise €1.4 Billion for Housing
- Canada Announces C$248,063 Investment to Restore Nova Scotia Lighthouse and Support Tourism
- New York’s New CPA Licensing Law Takes Effect, Adding 120-Credit Pathway
- Nasdaq Rule Removing CORE FIX Order-Entry References Becomes Operative
- Monte dei Paschi Calls Intesa Takeover Offer Financially Fair but Says It Undervalues Future Potential