
U.S. Outdoor Recreation Economy Reaches $704.2 Billion, New Federal Data Show
Outdoor recreation contributed 2.3% of U.S. GDP in 2025, though inflation-adjusted growth slowed to 1.9% and lagged the broader economy.
Our editorial standards
MarketReview publishes clear, independently produced financial information using reliable sources and transparent editorial standards.
Read our Editorial Policy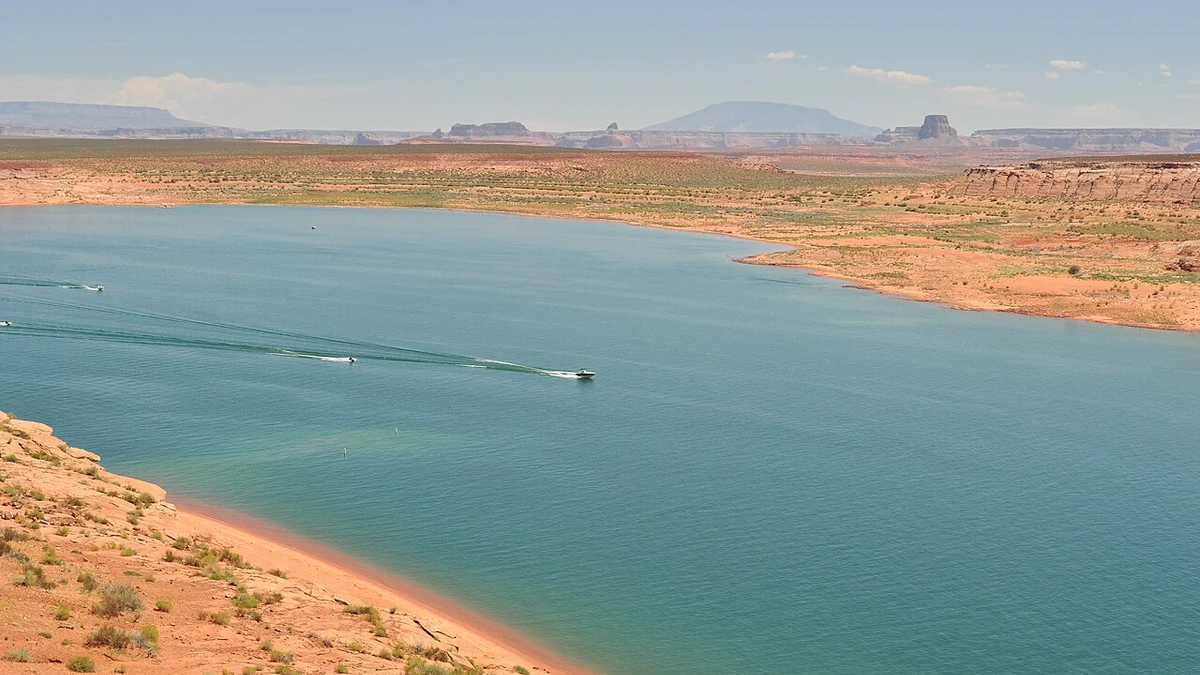
The U.S. outdoor recreation economy contributed $704.2 billion to gross domestic product in 2025, accounting for 2.3% of the national economy, according to new federal figures released Wednesday. The total covers economic activity linked to outdoor pursuits and the businesses that support them, rather than just the amount Americans spent on recreation.
Growth was more subdued after adjusting for inflation. Real GDP generated by outdoor recreation increased 1.9% in 2025, compared with 2.3% for the overall U.S. economy, and slowed from the sector’s revised 2.5% growth rate in 2024.
The Bureau of Economic Analysis (BEA) published the figures in its annual outdoor recreation economic statistics, which measure contributions across the 50 states and Washington, D.C. The release also updates estimates for earlier years, giving a revised basis for assessing changes in this part of the economy.
The $704.2 billion figure is a measure of value added, the industry’s contribution to GDP after subtracting goods and services used in production. It should not be read as a tally of outdoor equipment purchases, travel bills or other consumer spending. That distinction matters when comparing the figure with retail sales or industry estimates that measure spending rather than economic output.
Supporting services make up the largest share
More than half of outdoor recreation’s value added came from activities that support recreation rather than from conventional outdoor pursuits themselves. Supporting activities accounted for 51.5% of the sector in 2025, while conventional activities such as boating, biking and hiking represented 29.2%. A further 19.3% came from other recreation activities, including gardening and outdoor concerts.
The supporting category encompasses travel and tourism, local trips, construction and certain government expenditures associated with outdoor recreation. It helps explain why a sector often pictured in terms of campsites, trails and waterways also has economic ties to hotels, transportation businesses and other services used during recreation trips.
Among industry groups, arts, entertainment, recreation, accommodation and food services provided the largest share of outdoor recreation value added. Their contribution totaled $179.5 billion, or 25.5% of the national outdoor recreation economy. These figures refer to the outdoor recreation-related portion of the industries, not to all economic activity in restaurants, hotels or entertainment.
Retail trade followed at $166.5 billion, representing 23.6% of outdoor recreation value added. Transportation and warehousing contributed $86.4 billion, or 12.3%. Together, those figures illustrate how the economic effects of recreation extend beyond the activity itself, but they are GDP contributions, not the gross sales of every business involved.
The broader operating measures also moved at different rates. Real gross output rose 2.1% in 2025, compensation associated with outdoor recreation increased 4.6%, and wage-and-salary employment grew 1.7%. BEA’s employment measure includes full-time, part-time and temporary payroll jobs but excludes self-employed workers, whose production is nevertheless included in value added.
Boating and RVs lead conventional recreation
Boating and fishing were the largest conventional outdoor recreation category, generating $39.1 billion in current-dollar value added. That category ranked first among conventional activities in 35 states and the District of Columbia, underscoring its geographical reach even though outdoor activities vary widely by region.
Florida contributed $4.5 billion in boating and fishing value added, followed by California with $3.3 billion and Texas with $3.0 billion. The figures capture economic production attributable to the activity, which can include relevant goods and services, rather than the number of people taking part or the total they paid for boats and fishing trips.
Recreational vehicles were the second-largest conventional category, at $26.8 billion, and led conventional activities in 10 states. Indiana accounted for $4.7 billion of RV-related value added, ahead of Texas at $2.6 billion and California at $2.1 billion. Indiana’s prominent position also reflects the way BEA assigns manufacturing activity to the state where goods are produced, not necessarily where they are ultimately used.
Hunting, shooting and trapping ranked third nationally among conventional activities, contributing $15.1 billion. It was the leading conventional category in Arizona and Wyoming. Snow activities were smaller nationally at $7.8 billion, but represented the largest conventional category in Colorado, Utah and Vermont.
The relative weight of the major activity groups changed only modestly from the previous year. Conventional recreation’s share edged up from 29.1% in 2024 to 29.2% in 2025, and the share of other recreation activities increased from 19.1% to 19.3%. Supporting activities slipped from 51.7% to 51.5%, remaining comfortably the largest part of the total.
State exposure and employment gains vary
Outdoor recreation accounted for different shares of economic output across the country. Hawaii had the highest contribution relative to its state GDP, at 6.1%, while the District of Columbia had the lowest, at 1.0%. Those percentages measure how much of each economy is tied to recreation and should not be confused with a ranking of states by their total dollar contribution.
The employment picture was similarly uneven. Outdoor recreation jobs increased in 43 states and the District of Columbia during 2025. Rhode Island, Kansas and the District of Columbia each recorded a 5.0% increase, the highest rates reported by BEA, while New Jersey and Alabama each registered a 1.1% decline.
The leading industry group also differed by state. Arts, entertainment, recreation, accommodation and food services contributed the most outdoor recreation value added in 25 states and the District of Columbia. Retail trade held the top spot in 22 states, while transportation and warehousing was the largest contributing industry group in Alaska.
For the arts, entertainment, recreation, accommodation and food services group, California recorded $23.5 billion in outdoor recreation value added, Florida $23.4 billion and New York $11.6 billion. California also led retail trade with $19.5 billion, followed by Texas at $14.6 billion and Florida at $13.3 billion. These are measures of the recreation-related portion of each industry in the respective state.
BEA allocates outdoor recreation production by where the economic activity occurs, rather than where the customer lives. A boat manufactured in one state counts toward production there even if it is used on a lake elsewhere; a boating lesson is generally attributed to the place where the service is provided. Imported goods do not add domestic manufacturing value, although the domestic retail services associated with selling them can count.
The agency revised its 2021 through 2024 estimates using newer source information and annual updates to national and regional economic accounts. That means comparisons with figures published in earlier releases need to account for revisions. BEA’s next outdoor recreation economic statistics, covering 2026, are scheduled for fall 2027.
More News

Latest News
View all news- TJX Reports 4% Comparable-Sales Growth and $1.34 in Adjusted Quarterly Earnings Per Share
- McGraw Hill Sets 5%–8% Long-Term Revenue Growth Target, Outlines Cash Flow Plan
- Infinity Natural Resources Signs Reorganization Agreement, Targets December 1 Closing
- Atlanta Fed Lowers Fourth-Quarter GDPNow Growth Estimate to 3.2%
- U.S. Pending Home Sales Fall 4.7% in October, Marking Second Straight Month of Record-Low Contracts
