
U.S. Pending Home Sales Fall 4.7% in October, Marking Second Straight Month of Record-Low Contracts
Signed contracts for existing homes declined in every U.S. region, with the West posting the sharpest drop as October extended September’s record-low level of activity.
Our editorial standards
MarketReview publishes clear, independently produced financial information using reliable sources and transparent editorial standards.
Read our Editorial Policy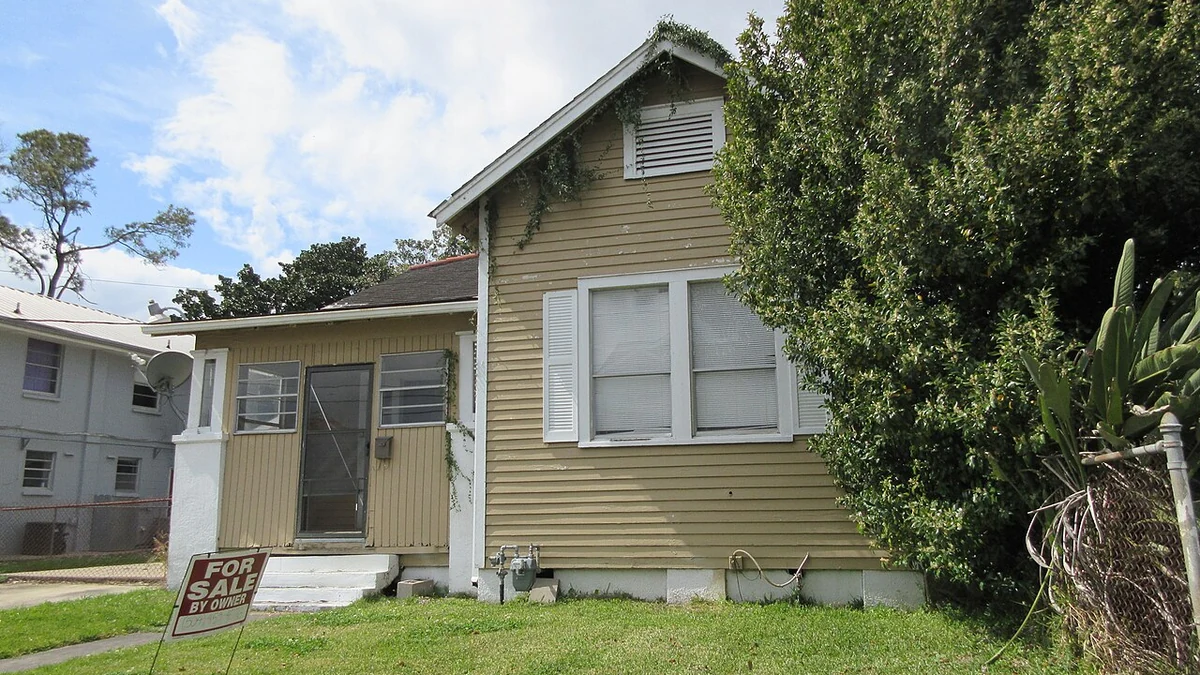
U.S. pending home sales fell 4.7% in October, extending the housing market’s decline to a second consecutive month of record-low contract signings, the National Association of Realtors reported Wednesday. The number of existing homes going under contract was 16.7% below the level recorded a year earlier.
All four major regions reported fewer signed contracts than in September, with the steepest monthly declines in the West and South. The figures suggest that the slowdown in completed home sales could persist into the final months of the year, even as mortgage borrowing costs have eased from their October highs.
The association’s October pending home sales report described September and October as back-to-back record lows. Its chief economist, Lawrence Yun, suggested October could prove to be the bottom of the current housing cycle, but that is an assessment of where conditions may be heading, not evidence that a recovery has begun.
Pending sales track contracts signed on existing houses, rather than sales that have already closed. Most contracts eventually lead to a closing within one or two months, making the measure an early indicator of resale activity. Financing problems, inspections, appraisals or other delays can still prevent a signed agreement from becoming a completed sale.
Every region posted a decline, led by the West
Western states registered the largest month-over-month drop at 6.9%, followed closely by a 6.3% decline in the South. Signings fell 2.7% in the Midwest and 0.8% in the Northeast. The magnitude differed, but none of the regions registered an increase from September.
Compared with October 2025, pending contracts in the West were down 20.3%, compared with an 18.7% decline in the South. The Midwest recorded a 14.0% annual drop and the Northeast an 11.1% decrease. Those figures show that the weakness was not confined to a single part of the country or merely a month-to-month fluctuation.
Regional differences matter because the national measure combines housing markets with different price levels, inventories and local economic conditions. The West’s relatively steep decline does not mean every city there experienced the same change, just as the Northeast’s smaller monthly fall does not mean contract activity was healthy. Both regions had fewer pending contracts than a year earlier.
At the metro level, the pullback extended across large housing markets. Among the 50 largest metros, even those with the smallest year-over-year declines were still below their earlier levels. Cincinnati had the smallest reported annual drop, at 4.7%, followed by Austin at 9.7% and Hartford at 10.0%, according to metro data cited by the association. Those are relative bright spots only when compared with more severe declines elsewhere.
September had already produced a sharp setback. In its October 20 release, the association initially reported a 7.3% monthly fall in pending sales for September. October’s further drop therefore came after an unusually weak preceding month, rather than reversing that earlier loss. The two-month pattern is central to Yun’s warning about the likely pace of closings near the end of the year.
Mortgage rates remain a central obstacle
Higher borrowing costs have been a major constraint on housing demand. The 30-year fixed mortgage rate reached 7.40% in Freddie Mac’s weekly surveys dated October 8 and October 15. It was 7.24% by October 29 and had fallen to 7.11% by November 12, according to Freddie Mac’s mortgage-rate archive. Those figures describe average rates for the specified survey weeks, not the rate available to every household.
Most of October’s pending contracts were signed before the latest easing in mortgage rates. A lower rate in November may improve affordability for some new borrowers, but it does not retroactively change the financing conditions buyers faced when October agreements were negotiated. Nor does a decline from a recent peak guarantee a quick rebound in activity.
Even modest changes in mortgage rates can materially alter the monthly principal-and-interest payment on a financed purchase, particularly in markets where home prices are high. Buyers must also meet down-payment requirements, taxes, insurance and other ownership costs. A household may be able to afford a given asking price at one interest rate but not at another, which can reduce the pool of buyers able or willing to enter contracts.
Completed sales tell a related but separate story. On November 12, NAR reported that existing-home sales fell 5.5% in October to a seasonally adjusted annual pace of 3.75 million, while total unsold inventory rose to 1.59 million homes. That inventory represented 5.1 months of supply, up from 4.7 months in September. Completed October sales and pending October contracts describe different stages of the buying process, so the two monthly percentage declines should not be treated as interchangeable.
Meanwhile, the median price of an existing home sold in October was $416,700, an increase of 0.4% from a year earlier, according to the same NAR report. A slower sales market therefore did not coincide with a drop in the national median price. That median reflects which properties happened to sell, however, rather than measuring price changes for an identical group of homes.
Weak contract signings point to a subdued year-end
NAR’s Pending Home Sales Index measures signed agreements for existing single-family homes, condominiums and co-ops. It is based on a sample covering roughly 40% of multiple listing service data each month. Its benchmark of 100 corresponds to average contract activity in 2001, the year the series began. A record low in the index signals exceptionally weak contract activity in that series, not a precise nationwide count of homes sold.
Yun said the two record-low months indicate very sluggish fourth-quarter sales closings. He also raised the possibility that total existing-home sales for 2026 could be the lowest since the mid-1990s. That comparison is a forecast based on the current trend, not an annual result that has already been reported.
Whether lower borrowing costs will bring buyers back is not yet established. A buyer who delayed signing a contract when borrowing costs were rising could return if financing becomes more affordable, but other obstacles remain. Availability of suitable homes, household budgets and the ability to qualify for a mortgage all influence whether interest from potential buyers becomes a signed deal.
Comparing pending and completed sales will be particularly important over the next several reports. A contract signed in October may close in November or December, and some sales can take longer. The figures released Wednesday therefore give an advance reading on future closings without specifying exactly how many will occur or when.
NAR is scheduled to publish its next existing-home sales report, covering November closings, on December 9. Its next pending home sales release, covering November contract activity, is scheduled for December 17. Those reports will show whether the decline in signed agreements extended beyond October and how much of the weakness has carried through to completed sales.
More News

Latest News
View all news- TJX Reports 4% Comparable-Sales Growth and $1.34 in Adjusted Quarterly Earnings Per Share
- McGraw Hill Sets 5%–8% Long-Term Revenue Growth Target, Outlines Cash Flow Plan
- Infinity Natural Resources Signs Reorganization Agreement, Targets December 1 Closing
- U.S. Outdoor Recreation Economy Reaches $704.2 Billion, New Federal Data Show
- Atlanta Fed Lowers Fourth-Quarter GDPNow Growth Estimate to 3.2%
