U.S. Housing Starts Rise 9.9% in October Even as Building Permits Drop 7.4%
Homebuilding starts rebounded to a 1.309 million annual pace, but new permit approvals declined and the estimated rise in starts was not statistically significant.
Our editorial standards
MarketReview publishes clear, independently produced financial information using reliable sources and transparent editorial standards.
Read our Editorial Policy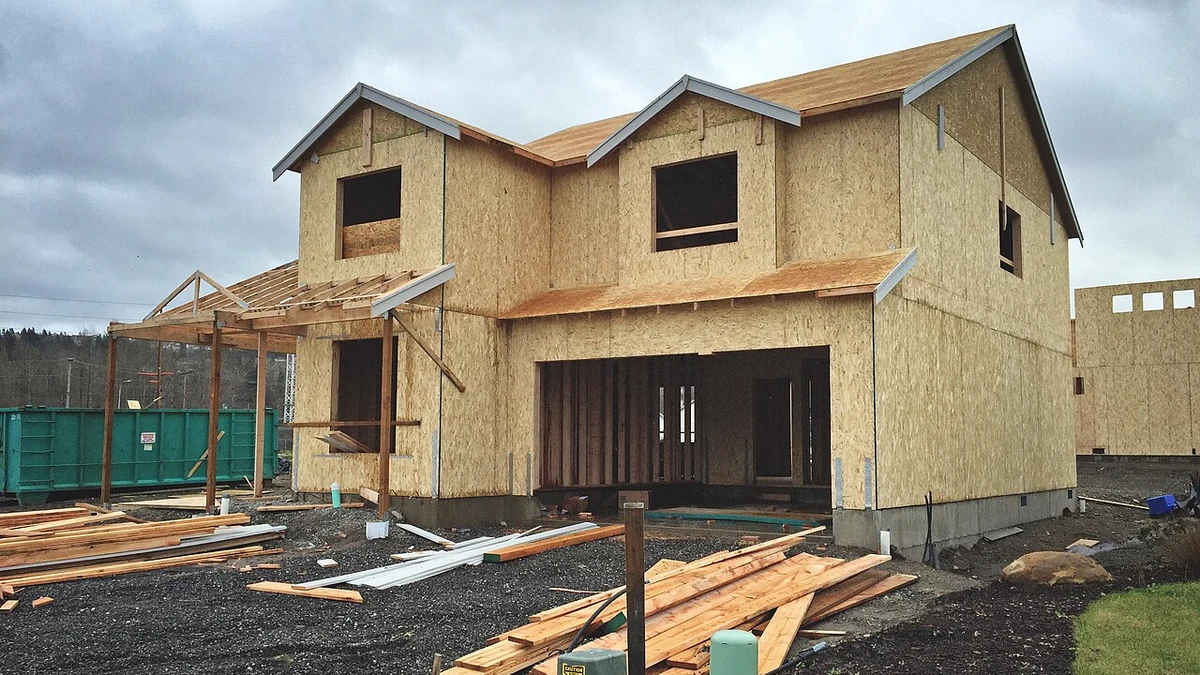
U.S. homebuilders broke ground on more homes in October, but a sharp decline in building permits offered a less encouraging indication of the projects coming into the construction pipeline. Privately owned housing starts rose 9.9% from September to a seasonally adjusted annual rate of 1.309 million units, while permit authorizations fell 7.4% to 1.295 million, according to figures released Wednesday, November 18, by the Census Bureau and the Department of Housing and Urban Development.
The split was especially clear in single-family housing. Starts for one-unit homes increased 4.0% to an annual pace of 864,000, but permits for that category dropped 8.7% to 772,000. Builders can begin work on homes authorized in earlier months, so a rise in starts alongside fewer new approvals is possible without a corresponding improvement in the outlook for future construction.
Both headline figures are annualized rates, rather than the literal number of homes started or permitted in October. The Census Bureau adjusts for usual seasonal patterns and expresses the monthly pace as a yearly rate. Its October residential construction report also cautions that starts estimates can move substantially as additional survey information becomes available.
Permit approvals retreat, led by single-family housing
October permits were down from September’s revised 1.398 million annual rate and 8.7% below the 1.418 million recorded a year earlier. The latest figure marked a deterioration in authorizations even as the number of projects getting underway increased. Permits are watched as an early indicator because approval normally comes before work begins, although the time between the two stages varies from project to project.
Single-family permits fell to 772,000 from 846,000 in September. Compared with October 2025, they were down 12.9%, a steeper annual decline than the 8.7% drop in total permits. That difference is important because it shows that the reduction in future authorizations was concentrated more heavily in standalone homes than in the overall mix of residential building types.
For buildings containing five or more housing units, the October authorization rate was 475,000, compared with 501,000 in September. That was a 5.2% monthly decline, but only about 0.4% below the year-earlier rate. Multifamily approvals therefore looked relatively steadier over the longer comparison, even though they also contributed to the monthly fall in total permits.
The geographical breakdown was uneven but broadly negative. The South, which accounted for more than half of the national October permit rate, registered a 10.7% monthly decline to 675,000 units. Permits fell 6.9% in the Northeast and 4.6% in the West. The Midwest was the exception, edging up 0.5%. Those regional changes reinforce the national decline without proving that local housing markets have entered a sustained downturn.
The stock of units authorized but not yet started also moved lower. Census estimated 276,000 such homes and apartments at the end of October on a seasonally adjusted basis, down from 286,000 in September. Unlike the headline permit figure, this is a count of units in the waiting-to-start pipeline rather than an annualized flow. It covers authorizations issued in any previous month and excludes permits that have been cancelled or otherwise invalidated.
A fall in newly issued permits can eventually translate into fewer starts if it persists. October’s figures alone do not establish that outcome, however. A builder may still have previously approved work to begin, and the timing of construction can depend on financing, site readiness and sales plans. The gap between permits and starts is therefore informative, not a direct forecast of the next month’s activity.
Starts recover from a revised September low
The reported 9.9% rise in starts followed a weak September reading. Total starts increased from a revised annual rate of 1.191 million to 1.309 million in October, putting the latest estimate 2.8% above the 1.273 million rate in October 2025. The monthly rebound was visible in the published figures, but the statistical uncertainty around it was substantial.
The Census Bureau attached a margin of error of 16.8 percentage points to the 9.9% monthly increase, using a 90% confidence interval. That range includes zero, meaning the survey does not provide sufficient statistical evidence to conclude that the underlying change was an increase rather than a decrease. The 2.8% year-over-year rise also came with a 16.5-percentage-point margin of error and was not statistically significant.
The same qualification applies to one-unit homes. Their estimated starts rose 4.0%, but the margin of error was 9.0 percentage points. In larger apartment buildings, starts reached an annual rate of 433,000 units, up from 345,000 in September. The resulting 25.5% estimated monthly gain carried a particularly wide 50.6-percentage-point margin of error. That makes the apparent jump in multifamily construction a poor basis for declaring a durable recovery.
Revisions also help explain the size of October’s reported increase. When the September figures were first published, total starts were put at 1.221 million and single-family starts at 859,000. The October release lowered those September baselines to 1.191 million and 831,000, respectively. October’s growth rates are measured against the revised figures, so they should not be compared mechanically with the initially published September estimates.
Regionally, the Midwest had the largest estimated monthly increase in starts, up 48.4%, while the South rose 10.5%. Starts declined 20.8% in the Northeast and 2.6% in the West. The confidence intervals for these regional movements were wide as well, particularly in the smaller regions, making the national and regional results better suited to cautious interpretation than to sweeping conclusions about where construction is strengthening.
The longer year-to-date picture remained softer than October’s monthly figure might suggest. On a non-seasonally adjusted basis, approximately 1.143 million housing units were started during the first 10 months of 2026, down 1.1% from the comparable period a year earlier. Single-family starts were 4.6% lower over that span. The year-to-date totals provide a broader perspective, though they do not erase the uncertainty attached to any individual monthly release.
Completions rise as the construction backlog holds steady
Housing completions supplied a third part of the October picture. Builders finished homes at a seasonally adjusted annual rate of 1.272 million units, up 6.5% from September’s revised 1.194 million pace. Completions were nevertheless 10.4% below their October 2025 rate of 1.419 million. The reported month-to-month increase had a 13.2-percentage-point margin of error, so it too was not statistically significant at the Census Bureau’s 90% confidence level.
Single-family completions reached an annual rate of 900,000, up 6.3% from September, while completions in buildings containing at least five units reached 362,000. A completion reflects work that was started earlier, sometimes substantially earlier. It therefore provides information about finished housing supply rather than the immediate appetite for opening new construction projects.
There were an estimated 1.272 million housing units under construction at the end of October, little changed from September’s 1.273 million. That number is a seasonally adjusted inventory of unfinished units, not an annualized pace like the starts and completions figures. About 581,000 were single-family units and 674,000 were in buildings with five or more units, with smaller structures accounting for the remainder.
Taken together, the pipeline figures show why the monthly data should not be reduced to a single verdict on homebuilding. Permits count newly authorized housing, starts track the beginning of construction, and completions record the end of building work. Activity at one stage can move differently from another because those projects entered the process at different times. Higher October starts do not cancel out the drop in permits, just as fewer permits do not establish that construction has already contracted.
Census advises that month-to-month movements can be irregular and says it may take about three months to establish an underlying trend in permits and six months for starts or completions. The agency also noted a scheduled survey sample redesign beginning with its January 2027 construction estimates. For the nearer term, revised October building-permit figures are due November 25, followed by the November residential construction report on December 17.
More News


Latest News
View all news- TJX Reports 4% Comparable-Sales Growth and $1.34 in Adjusted Quarterly Earnings Per Share
- McGraw Hill Sets 5%–8% Long-Term Revenue Growth Target, Outlines Cash Flow Plan
- U.S. Outdoor Recreation Economy Reaches $704.2 Billion, New Federal Data Show
- Atlanta Fed Lowers Fourth-Quarter GDPNow Growth Estimate to 3.2%
- U.S. Pending Home Sales Fall 4.7% in October, Marking Second Straight Month of Record-Low Contracts