Case-Shiller U.S. Home-Price Growth Accelerates to 1.5% in June
National home prices rose faster than in May, but the gain remained below inflation and regional trends ranged from a 6.9% rise in Chicago to a 2.0% decline in Seattle.
Our editorial standards
MarketReview publishes clear, independently produced financial information using reliable sources and transparent editorial standards.
Read our Editorial Policy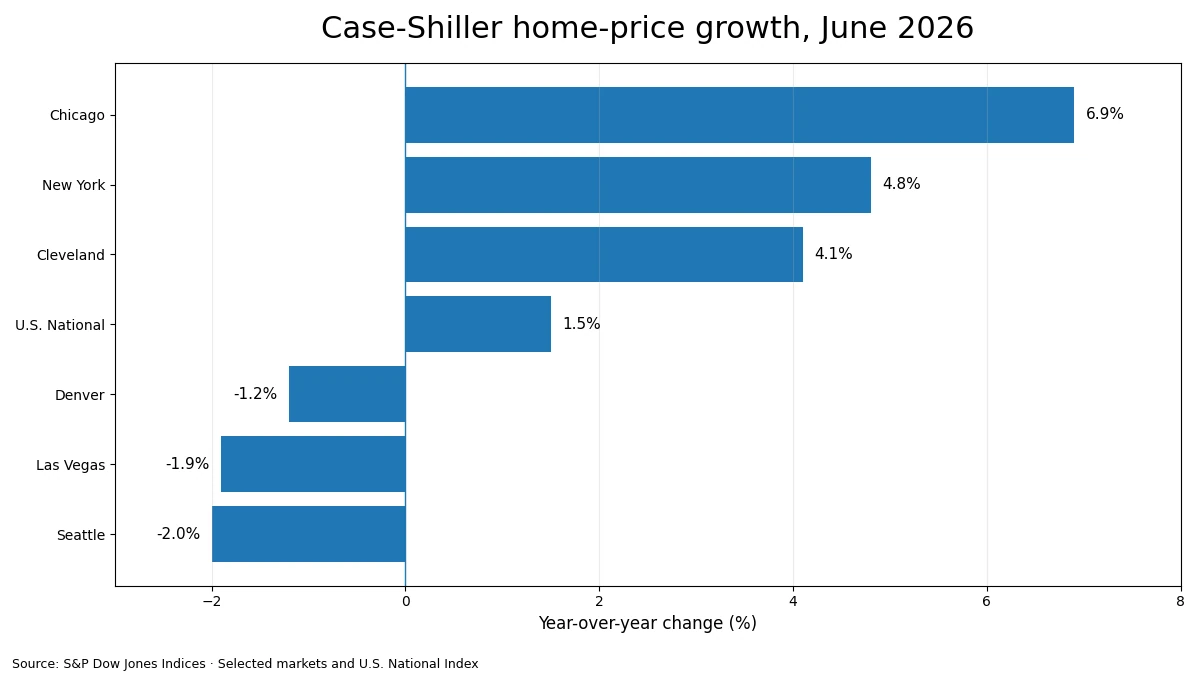
U.S. home-price growth accelerated in June, with the S&P Cotality Case-Shiller U.S. National Home Price NSA Index rising 1.5% from a year earlier. The increase was stronger than the 1.2% annual gain reported for May in S&P Dow Jones Indices’ latest comparison, pointing to a modest pickup in nominal price growth after a long period of cooling.
The broader city measures strengthened as well. The 10-City Composite rose 2.9% from a year earlier, up from 2.4% in May, while the 20-City Composite increased 2.1%, compared with 1.6% in the previous month. On a non-seasonally adjusted basis, the national index and the 20-City Composite each gained 0.4% from May, and the 10-City Composite rose 0.5%.
The June Case-Shiller release also showed that price gains continued to lag inflation. Consumer prices were 3.5% higher than a year earlier in June, according to the Bureau of Labor Statistics, compared with the 1.5% rise in the national home-price index. S&P DJI said that marked the 13th consecutive month in which U.S. home values declined in real, inflation-adjusted terms.
Chicago leads as regional price trends remain sharply divided
The national acceleration masked large differences among metropolitan areas. Chicago led the markets covered by the 20-City Composite for a fourth consecutive month, with prices up 6.9% from June 2025. New York followed with a 4.8% annual increase and Cleveland was up 4.1%.
Several Western and Sun Belt markets remained much weaker. Seattle posted the largest annual decline at 2.0%, followed by Las Vegas at 1.9% and Denver at 1.2%. Dallas was down 0.7%, Phoenix fell 0.9%, Portland slipped 0.4% and Tampa declined 1.2% from a year earlier. By contrast, San Francisco was up 3.2%, Boston gained 2.7% and Miami rose 2.3%.
The month-to-month figures showed a similarly uneven pattern before seasonal adjustment. New York rose 1.03% in June, Cleveland gained 0.98% and Chicago increased 0.95%. Seattle fell 0.47%, San Diego declined 0.14%, Phoenix dropped 0.10% and San Francisco eased 0.08%. After seasonal adjustment, the national index rose 0.13%, the 10-City Composite gained 0.35% and the 20-City Composite increased 0.24%.
Detroit was not included in the valid June city results because recording delays in Wayne County left S&P DJI without enough timely sales data for a June update. The provider said it had enough information to calculate a May reading and would continue updating the Detroit series as delayed records become available. That caveat matters when comparing the 20-city results with earlier months because one of the component markets did not have a current June observation.
Despite the slower pace of appreciation seen over the past year, the nominal level of the national index remains above the highs reached earlier in the current housing cycle. S&P DJI put the June national index at 336.66, 9.3% above the June 2022 level identified in its peak-and-trough table and 15.0% above the January 2023 trough. The 20-City Composite was 9.9% above its June 2022 level and 17.7% above its January 2023 trough.
FHFA data also point to modest national appreciation
A separate federal measure released the same day showed a similar pattern of positive but restrained national price growth. The Federal Housing Finance Agency said U.S. house prices rose 2.1% between the second quarter of 2025 and the second quarter of 2026. Prices were up 0.3% from the first quarter, while FHFA’s seasonally adjusted monthly index for June was unchanged from May.
The two indexes are not directly interchangeable. Case-Shiller combines matched price pairs for thousands of single-family homes and its national measure covers the nine U.S. Census divisions. FHFA’s flagship index uses a weighted repeat-sales approach based on purchase-only data from mortgages bought or guaranteed by Fannie Mae and Freddie Mac. Differences in coverage, weighting and data sources can therefore produce different national readings even when both measures point in the same general direction.
FHFA reported annual price increases in 46 states and the District of Columbia during the second quarter. Alaska had the largest state-level gain at 8.3%, followed by Vermont at 7.3%, Hawaii at 5.8%, and Illinois and West Virginia at 5.6% each. Four states recorded declines, with New Mexico posting the largest decrease at 1.2%.
The federal data also showed a broad regional split that resembles the dispersion in the Case-Shiller city results. FHFA said prices rose in 76 of the 100 largest metropolitan areas over the prior four quarters. Elgin, Illinois, recorded the strongest increase at 7.7%, while Everett, Washington, had the largest decline at 3.7%. Among the nine Census divisions, East North Central posted the strongest annual appreciation at 4.5%, and the Pacific division was barely positive.
High financing costs and ample new-home supply remain constraints
Price growth is firming even though borrowing costs remain elevated. Freddie Mac’s Primary Mortgage Market Survey put the average 30-year fixed mortgage rate at 6.65% on Aug. 20, compared with 6.58% a year earlier. S&P DJI said 30-year rates had held near 6.5% in June, keeping financing costs high for prospective buyers and reducing the incentive for owners with older, lower-rate mortgages to move.
Fresh government data on the new-home market also pointed to a softer demand backdrop. The Census Bureau and Department of Housing and Urban Development estimated that new single-family home sales ran at a seasonally adjusted annual rate of 607,000 in July, 10.5% below the revised June pace of 678,000. The reported monthly change carried a margin of error of plus or minus 14.0 percentage points, so the estimate does not establish a statistically significant decline.
Builders had an estimated 488,000 new homes for sale at the end of July, equivalent to 9.6 months of supply at the current sales pace. That was up from 8.5 months in June. The median price of a new home sold in July was $393,800, 0.9% below the July 2025 estimate, although that year-over-year comparison also had a wide margin of error.
Taken together, the June price indexes and the July sales figures describe a housing market in which nominal home values are still rising nationally but buyers remain constrained by financing costs and abundant new-home inventory. The next FHFA monthly home-price report, covering July, is scheduled for Sept. 29. S&P DJI says its Case-Shiller indexes are published on the last Tuesday of each month, which also places the next scheduled release on Sept. 29.
More News



Latest News
View all news- Gold Futures Retreat Toward $4,190 as U.S. Dollar Strengthens
- IonQ Agrees to Buy Cybersecurity Firm Elisity for Up to $1.3 Billion
- KKR, TotalEnergies to Add $1.2 Billion Solar Portfolio to U.S. Venture
- U.S. 30-Year Mortgage Rates Hover Near 7.55% as Housing Borrowing Costs Remain Elevated
- Wall Street Volatility Gauge Rises as Traders Assess Inflation and Earnings Risks